As we now enter the second half of January in a new year, the persistent trading range continues.
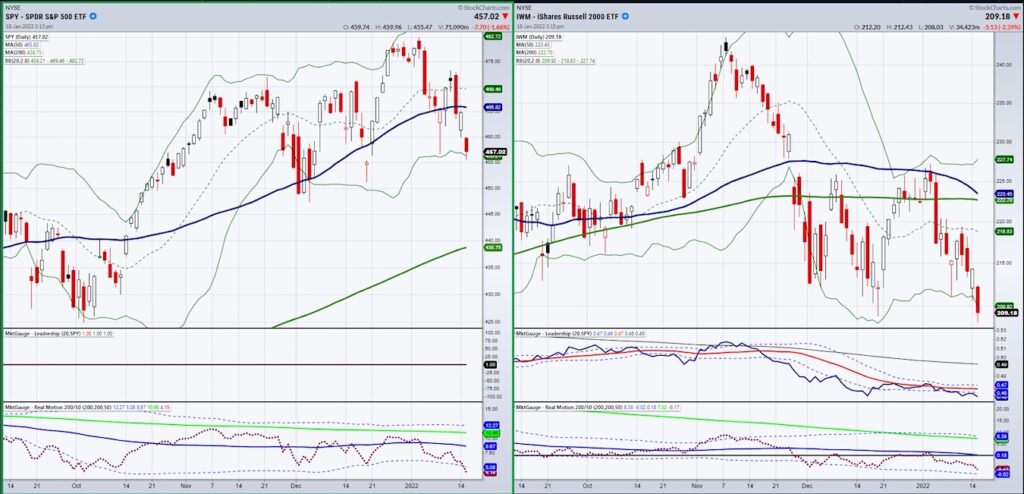
Particularly in the small caps or Russell 200 (IWM), since February 2021, the trading range has been from 204-233.
As we begin this week, IWM is tackling the December 2021 low and quite possibly could see a return to the 204 support area.
However, today also begins another trading range, the 6-month calendar range.
Each January, that range is reset and remains intact until the next reset in July. The significance is that once we have a trading range to go off of for the next six months, we can easily see trend reversals or continuations based on that January range.
For example, looking at the SPY, 456.60 is the January calendar range low.
Today, the low was 455.31 but more importantly SPY closed at 456.51 or just millimeters under the 6-month calendar range low. As SPY has well outperformed the small caps, what can we assess from the ranges and today’s performance going forward?
Tuesday, with the steep drop, lots of bears came out of the woodwork.
I was on @TeamCavuto earlier today talking with David Asman. During that conversation, David reflected the fears of folks who believe inflation will be at double digits. The fear that the Fed will have to really juice up the rates to a point that kills the market and spins us from stagflation into recession. The fear that the labor market will continue to stifle supply chain.
And as you can hear from my comments, all these fears are reasonable.
However, even if things get worse before they get better, I do see some reasons to be cheerful.
The Transportation sector (IYT) is still in a weekly bullish phase. That means we WILL come back from Covid. We will travel, eat out, and spend more money again. The labor force will come back, if not completely, at least way more than what we see now.
And in the market, we still see a trading range.
Yes, this is a year of buying extreme lows and selling extreme highs.
It is a year of following the now $25 trillion of new individual investors that have opened trading accounts in the last 2 years. Not to mention the 292 billion stocks and ETFs that were bought-7 times larger than in 2019. And it is the year that 85% of hedge funds and 42% of asset managers now track what the retail investor is doing.
Call me optimistic, but this is great news. Why? Because retail investors will become smarter. They will have to stay in the game. Heck, that is how I got started!
And with increased money flow, that translates to better opportunities. It also tells me that the move to taking control over one’s own assets could decrease the volatility rather than increase it.
Therefore, buying the dips near trading range lows makes sense. So does exiting quickly if the range breaks. Conversely, buying the instruments that breakout out over the trading ranges makes sense. And, getting out quickly if those instruments fail to hold the breakout.
Stock Market ETFs Trading Analysis & Summary:
S&P 500 (SPY) 450 is major price support.
Russell 2000 (IWM) 204-205 is major price support; back over 216 important for bulls.
Dow Jones Industrial Average (DIA) 350 is major price support.
Nasdaq 100 (QQQ) 365 is the 200-DMA support.
KRE (Regional Banks) Inside day near the highs.
SMH (Semiconductors) 287.73 is price support, then 269.
IYT (Transportation) 260 is the 50-WMA (important to hold).
IBB (Biotechnology) 157-160 is major price support.
XRT (Retail) 82 is price support to hold.
Twitter: @marketminute
The author may have a position in mentioned securities at the time of publication. Any opinions expressed herein are solely those of the author and do not represent the views or opinions of any other person or entity.


