There’s a simple professional trader’s tactic for anticipating intra-day market reversals near the levels that later become the high or the low of the day.
This tactic worked perfectly at calling Monday’s high of the day in the S&P 500 ETF (SPY).
This simple indicator works even better when the market’s sector rotation leads the move like it did today, so let’s start there.
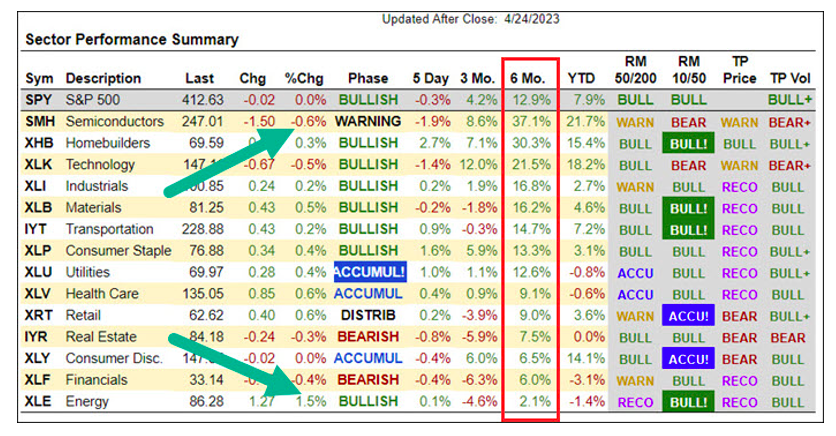
Today’s image is our sector summary table that you can find for free in the “Big View” section of marketgauge.com. The table is ranked by 6 Month change (outlined in red) because we’ve found that time frame to be significant when gauging the persistence of trends.
As you can see, there was an interesting pattern of market rotation today (pointed out by the green arrows).
The pattern is simply that the leading sector (over the last 6 months), the Semiconductors Sector ETF (SMH), was Monday’s biggest loser on a percentage basis, while in contrast, the weakest sector, the Energy Sector ETF (XLE), was Monday’s biggest winner.
In an otherwise quiet, choppy day, this sector rotation bookended the mood of traders who were focused on bespoke stock stories like earnings that didn’t translate into a general market trend.
If you read yesterday’s edition of this article, “SMH Bulls Are Skating On Thin Ice,” weakness in this leading sector shouldn’t come as a surprise.
If you’re also aware of our simple tactics for anticipating intra-day market reversals and trend days, then the trend days in both SMH and XLE should not come as a surprise, even though they were bucking their longer-term trends.
The simple tactic I’m referring to that enables you to anticipate daily highs and lows and trend days is the proper use of the Opening Range indicator.
The two-sentence tutorial for understanding the Opening Range is as follows…
The low and high of the first 30 minutes of the day will be significant support and resistance, and you should look for reversal patterns at these levels. If the market exhibits a confirmed breakout beyond the O.R. high or low, it is often a trend day.
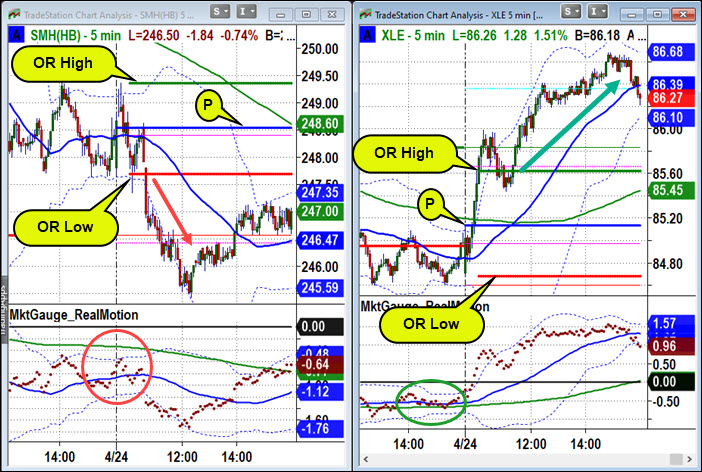
With that in mind, look at the intra-day charts of SMH and XLE.
Notice in the SMH chart that when the price broke the OR low it trended lower.
In the XLE chart, when the price broke the OR high it rallied, retraced to the OR high area, and then resumed its trend higher.
Now let’s look at the reversal at the high of the day in the SPY chart below.
Notice I’m showing you the QQQ chart too. The simple advanced Opening Range tactic for anticipating a market reversal is to look for divergences in the indexes at the Opening Range levels.
The red circles show an example of the SPY attempting to break over the OR high, while the QQQ demonstrates a significant negative divergence.
When you see a divergence like this, expect the SPY to reverse.
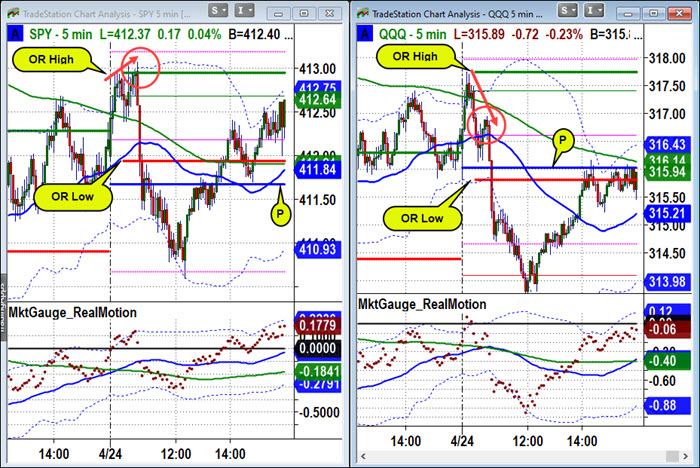
If you consider the two sets of charts together, you can see how the SHM started the day on a positive note, but never made an attempt to move over its OR high like the SPY, indicating that the market’s leader was not bullish today. This contributed to the weakness in the QQQ.
Intraday trading patterns aren’t just for day traders.
Today’s SMH chart is a good example of using the Opening Range to avoid buying into a weak day in the leading sector, but…
Of course if you’re reading this article daily, you know it’s not a good time to be buying SMH for other reasons.
Stock Market ETFs Trading Analysis & Summary:
S&P 500 (SPY) Tight range to watch this week 410-415 on a closing basis
Russell 2000 (IWM) 170 support- 180 resistance
Dow Industrials (DIA) Over the 23-month MA 336-support to hold
Nasdaq (QQQ) 312 support over 320 better
Regional banks (KRE) 44 now pivotal resistance
Semiconductors (SMH) 258 resistance with support at 246
Transportation (IYT) Still under the 23-month MA with 232 resistance 224 support
Biotechnology (IBB) 130 major pivotal area-135 resistance
Retail (XRT) 58- 64 trading range to break one way or another
Twitter: @marketminute
The author may have a position in mentioned securities at the time of publication. Any opinions expressed herein are solely those of the author and do not represent the views or opinions of any other person or entity.

 Testing Important Price Support")
: Cup (and Maybe Handle) Watch")

