Heads up, you wouldn’t know it by looking at its daily stock chart, but the Semiconductors ETF (SMH) is skating on some very thin ice.
Since the market’s lows in October 2022, the SMH has been one of the recent bull rally’s earliest and most influential supporters, but the same indicators that led its turn up last Fall have turned down this Spring.
This is potentially bad news for the uptrend in SMH and the general market trend.
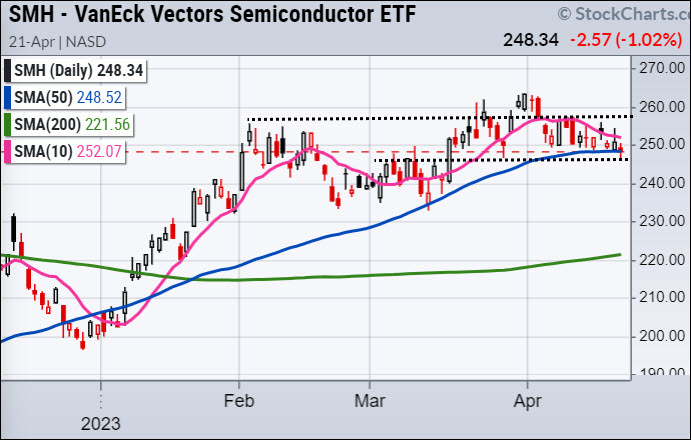
While it looks like the Semiconductors ETF (SMH) is sitting comfortably on its 50 DMA, there are indications it may break, and if it does, these indicators suggest it won’t come right back.
Looking at the chart below you’ll see the daily chart of the SMH sitting on its 50 DMA with three indicators below it – MG Leadership, MG Real Motion 50/200, and MG Real Motion 10/50.
If you’re familiar with these indicators, the circles and arrows should tell you the whole story.
If you’re new to the MarketGauge indicators…
The simplest form of analysis is that the green circles indicate a bullish change, the red circles indicate a bearish change, and as a result, the price trend should continue in the indicated direction.
The easiest way to measure a meaningful continuation or change in the price trend’s direction is a break of the 50 or 200 DMA as indicated by the arrows.
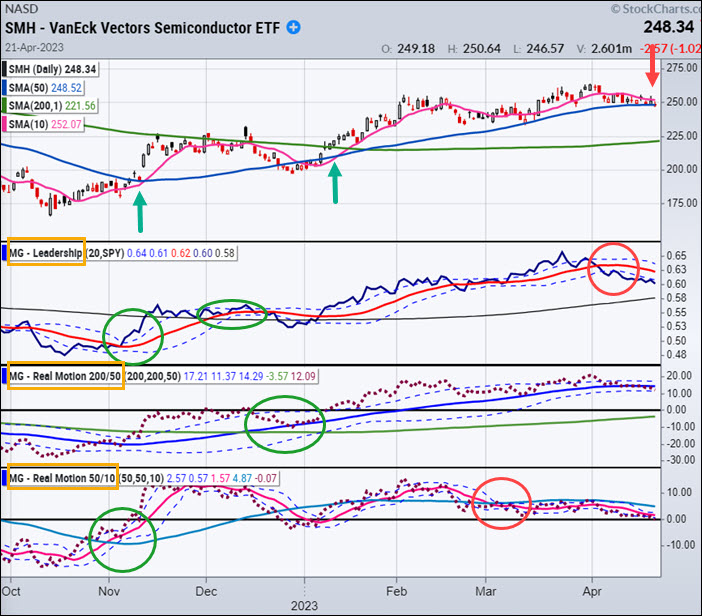
The summary is that Leadership turned bearish in early April and MG Real Motion, which is a momentum indicator, has been diverging in a bearish way since early March.
This divergence became more bearish when SMH made a new high while RM 10/50 was not able to trade higher than its 50 DMA. This is a big warning sign in Real Motion
As a result, the bearish inflection point is a clear break of the 50 DMA in price.
If the 50 DMA breaks, it’s likely to continue to slide until Real Motion and/or Leadership show a bullish posture.
It is possible for SMH to avoid breaking the 50 DMA and resume its uptrend. If that happens in a reliable way, then Leadership should turn up (blue over red) and RM 10/50 dots should trade over its blue moving average.
Until then, SMH is skating on very thin ice.
Stock Market ETFs Trading Analysis & Summary:
S&P 500 (SPY) Tight range to watch this week 410-415 on a closing basis
Russell 2000 (IWM) 170 support- 180 resistance
Dow (DIA) Over the 23-month MA 336-support to hold
Nasdaq (QQQ) 312 support over 320 better
Regional banks (KRE) 44 now pivotal resistance
Semiconductors (SMH) 258 resistance with support at 246
Transportation (IYT) Still under the 23-month MA with 232 resistance 224 support
Biotechnology (IBB) 130 major pivotal area-135 resistance
Retail (XRT) 58- 64 trading range to break one way or another
Twitter: @marketminute
The author may have a position in mentioned securities at the time of publication. Any opinions expressed herein are solely those of the author and do not represent the views or opinions of any other person or entity.


