It has been a tumultuous month for North American equities as trade tensions continue to boil, bond yields remain low and the 10-year/2-year U.S. yield curve inverted for the first time since the Global Financial Crisis.
This has the S&P 500 Index NYSEARCA: SPY skating on thin ice.
The macro-economic backdrop overshadowed a decent finish to the second-quarter earnings season, which was capped by economic barometer Wal-Mart increasing forwarded guidance.
This week we are revisiting our stock market correction watch indicators and recession canaries to determine if the worst is behind us or if this is the start of more pain for markets.
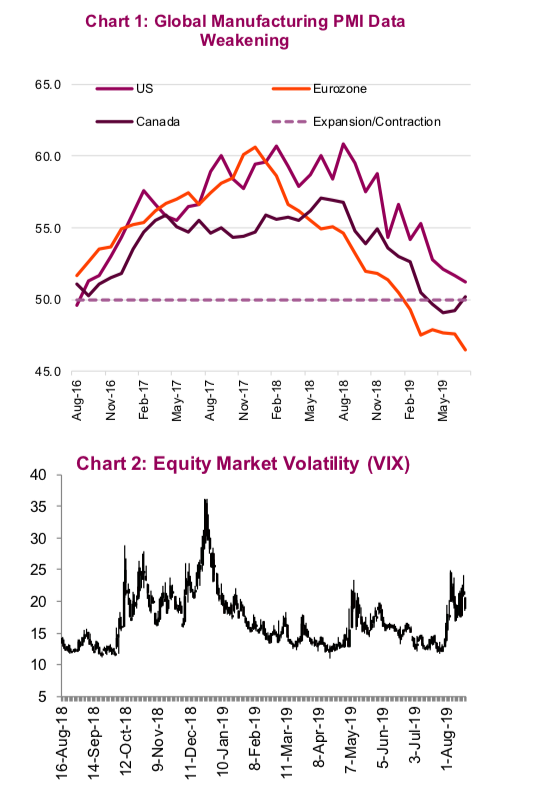
Manufacturing data and new orders (chart 1 further below) have been sliding for an extended period but the consumer has been relatively immune as the services sector and a strong employment backdrop have been enough to buoy the slowdown.
Our fear has been a contagion effect that starts leaking into the consumer and services data. In a speech made on August 15, Donald Trump said, “Consumers may have to cover the cost of China tariffs”. It appears they are already bearing some of the brunt as a trip to Wal-Mart was +5.2% more expensive in June compared to a year earlier.
At some point, consumers will not be able to cushion the blow.
However, although the twitter finger and voice of Mr. Trump say one thing, his actions last week told a different story. On August 13, the White House announced they will delay tariffs on a specific list of goods until December 15, from the proposed September 1 date. On the list were laptops, video game consoles, cellphones and footwear. It’s hard to think it’s coincidental that the list will most likely match the shopping list of many North Americans this upcoming holiday season.
The tariff delay that gave a boost to equity markets on August 13 was short lived because it was overshadowed the next day when the yield curve inverted based on 10-year Treasury yields dropping below 2-year yields. Equities moved lower in the morning and continued the slide throughout the day as bond yields fell due to rising recession risks.
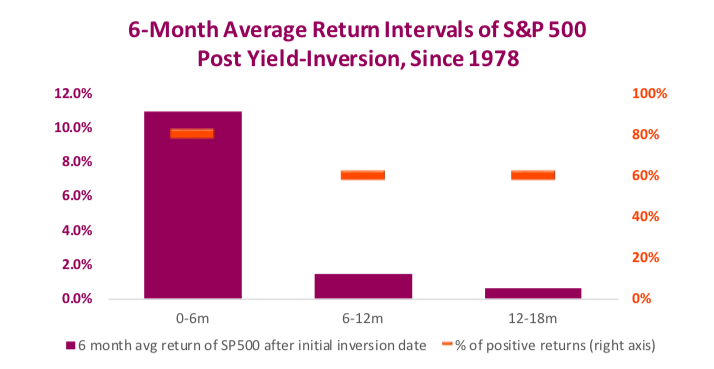
We have now had an inverted yield curve for a few months (based on 10-year versus 3-month Treasury yields) and it should not be lost on investors that an inverted yield curve has been a good harbinger of past recessions. While an inversion is certainly a bad omen, investors should consider that there tends to be fruitful gains before a recession takes hold.
A more prominent precursor we are watching that we think could be a canary in the coal mine for the next recession is falling corporate profit margins. Digging into the earnings released so far for Q2, there does not appear to be alarm bells ringing on that front. The low bar set by falling earnings expectations allowed all 11 sectors of the S&P 500 to beat expectations this quarter by an average 4.96%. But growth was a mixed bag with weakness from cyclical sectors such as Materials, Energy and Technology and strength from defensive industries like Health Care and Telecommunications. The S&P TSX results tell a similar story but all eyes will be on bank earnings which start this week and account for a 22% index weighting.
Corporate earnings coming in better than tempered expectations should not be too much of a surprise – this has been the trend for some time. But we remain equally focused on margins. With global growth slowing, especially in the manufacturing-related industries, plus rising labor and inputs costs, margins are at risk. Margins among larger-cap companies have remained near cycle highs but among mid- and smaller-cap companies there is rising pressure.
Our concern for margins is this: if the slowdown in growth spreads, companies will begin cutting back on spending to maintain margins. And remember, one company’s spending is another company’s revenue, so cost-cutting can spread through an economy and cause contraction.
So far, there is limited evidence of this, but it could be coming in the quarters ahead.
While the week ended on a positive note, investors remained on edge due to the heightened volatility. This could be just another ‘buy-the-dip’ opportunity that has become frequent during this long bull cycle; however, we have yet to see much on the capitulation side. Investor sentiment readings, courtesy of the American Association of Individual Investors, have gotten close to flashing a capitulation buy signal with only 23% of respondents bullish and 45% bearish (chart 4). However, other indicators have not.
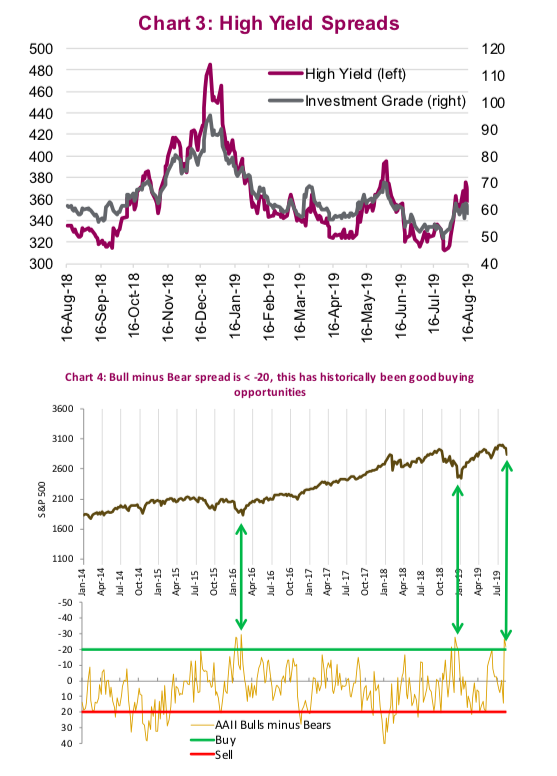
Despite 7 of the last 10 trading days representing moves higher than 1% in one direction or the other, the volatility index (VIX) is still some way from the extremes we saw at the end of 2018 (chart 2 above). Corporate bond spreads tell a similar story. High Yield and corporate bond spreads are still below the levels they reached in May (chart 3). Lastly, the correlation between stocks and bonds is around -0.61 we wouldn’t say that is over blown until is gets below -0.7.
While the media narrative seems to change abruptly from one day to the next, we continue to believe investors should not make any big changes at this time. This period of market weakness has not become deep enough to offer a compelling buying opportunity and we have yet to see capitulation signals become abundant. And while the risk of recession is elevated, our Market Cycle framework continues to indicate there is limited risk of the current market cycle ending. Sometimes (actually, more often than not) doing nothing is just the right thing to do.
Source: All charts are sourced to Bloomberg L.P. and Richardson GMP.
Twitter: @ConnectedWealth
Any opinions expressed herein are solely those of the authors, and do not in any way represent the views or opinions of any other person or entity.


 Pressuring Lower Price Support")


 Pressuring Lower Price Support")