As the major stock market indexes keep sliding lower into correction territory, and credit spreads edge wider, the ghosts of 2007-2008 are beginning to circle again.
But, it’s bark is louder than its bite thus far.
Today we’ll look at stock market correction comparisons since the financial crisis.
When comparing the current behavior of the equities and credit markets to what happened during the last three deep pullbacks post Great Financial Crisis, this correction is rather unremarkable.
Here is some basic data:
– The chart below shows the Investment Grade and High Yield CDX, and the IG & HY cash spreads going back to ’06. As you can see, for now the widening since the beginning of September of this year is rather muted both in absolute terms, and when compared to the last three major “spooks” and stock market corrections.
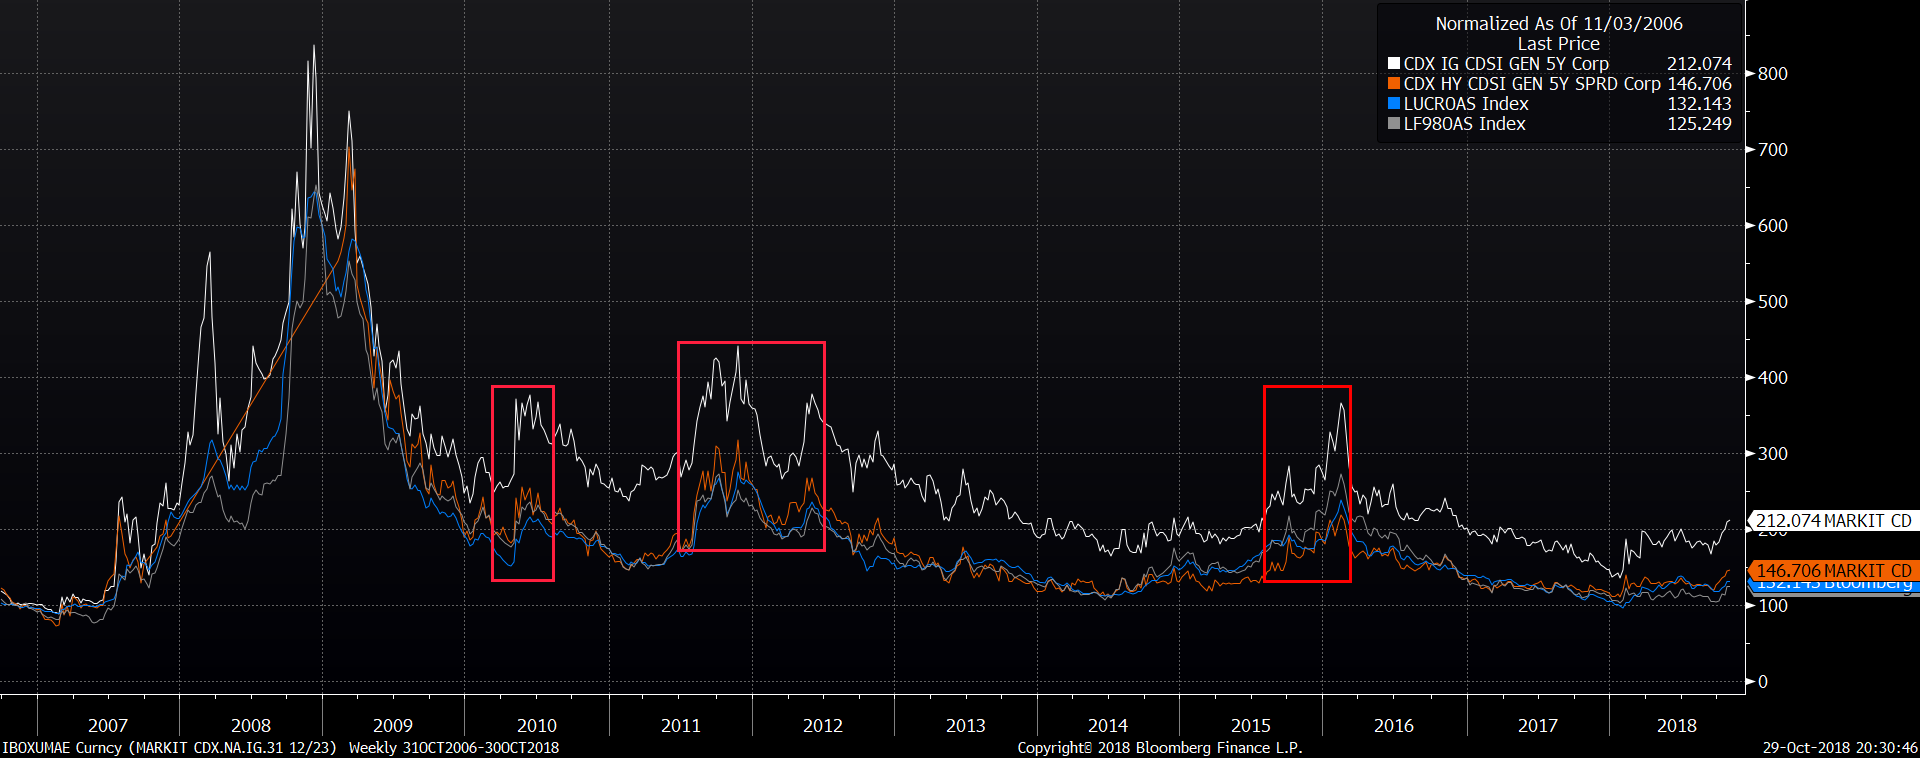
– During the three “boxed” periods in the chart (Q2 2010, Q3 ’11 to Q2 ’12, and Aug. ’15 to Feb. ’16), corporate credit average monthly issuance was $67B, $99B and $112B respectively. September and October (month-to-date) this year tally up to $174B and $110B.
– The S&P 500 drawdowns for the last three corrections were 16%, 18% and 14% respectively, and you can see that credit spreads blew out far more than they have so far. In other words, with stocks down 10% already since early September, credit spreads have significantly outperformed stocks.
– And lastly, since September – and just as in the three previous pullbacks – stocks led credit to the downside, which is exactly opposite to the ’00-’02 and ’07-’08 financial crisis, when the corporate bond market started unraveling way before equities.
Perhaps this time is different, and we keep plunging from here. But if one subscribes to the notion that credit is the major underpinning of equities, this correction looks just like the ones that preceded equity rallies to progressively higher highs.
Twitter: @FZucchi
The author has a position in the S&P 500 (SPX). Any opinions expressed herein are solely those of the author, and do not in any way represent the views or opinions of any other person or entity.


