S&P 500 Stocks Greater Than 200-Day Moving Average
The 200-day moving average helps us monitor the health of long-term trends.
In 2010 77 days after the correction ended, 59.6% of S&P 500 stocks were above their 200-day moving average.
In 2011 77 days after the market correction ended, 38.0% of S&P 500 stocks were above their 200-day moving average.
In 2015 77 days after the correction ended, 44.8% of S&P 500 stocks were above their 200-day moving average, which is better than 2011.
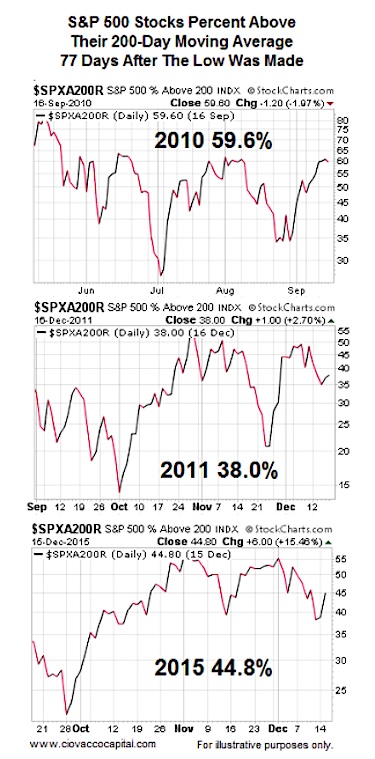
If the bull market continued in both 2010 and 2011, and 2015 market breadth in some cases is better relative to similar points in the 2010 and 2011 rallies off a correction low, then it is difficult to say breadth is a showstopper in 2015. Similar breadth stats in 2011 were not followed by a new bear market.
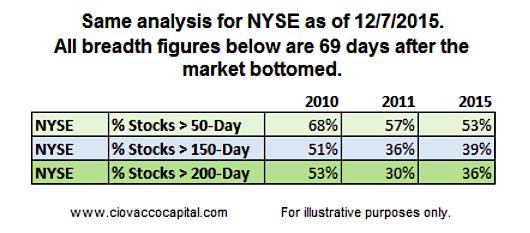
What About Breadth For Broader NYSE?
We ran a similar analysis on December 7 that included the NYSE Composite Stock Index. The table below summarizes the results. The advantage of looking at S&P 500 breadth is that it only looks at liquid common stocks, however you can make the argument that S&P 500 breadth is not representative of the broader market. To take a broader view of market breadth, on December 7 we looked at the same data based on the NYSE Composite Stock Index.
As the summary table below shows, 2015 recent breadth stats were not significantly different than at similar points during the 2010 and 2011 rallies. In fact, in some cases 2015 breadth was better.
Thanks for reading.
Twitter: @CiovaccoCapital
Read more from Chris on the CCM blog.
Author or his funds have long positions in related securities. Any opinions expressed herein are solely those of the author, and do not in any way represent the views or opinions of any other person or entity.


