Once again, the bears have the ball, 1st and goal from the 1 yard line. And, yes, we’ve seen this quite a bit in recent months with market bulls making many goal line stands.
The bears have tried too many trick plays in this position, and it’s time to take it right up the gut of the bulls defense and end this thing.
The S&P 500 is hanging on by a thread here, sitting right on trend line and price support between 1,870 and 1,880. The uptrend off the recent 1,812 low is in big time danger of breaking. That would open the door for a full retest of the recent stock market lows at the very least, and probably, something much worse.
As I said before, price support down toward the 1,810/1,820 area is almost nonexistent because the October 2014 rally was a “V” with no price structure = little support on the way down. There is little price structure down in that region from the January stock market lows as well (for the similar reasons).
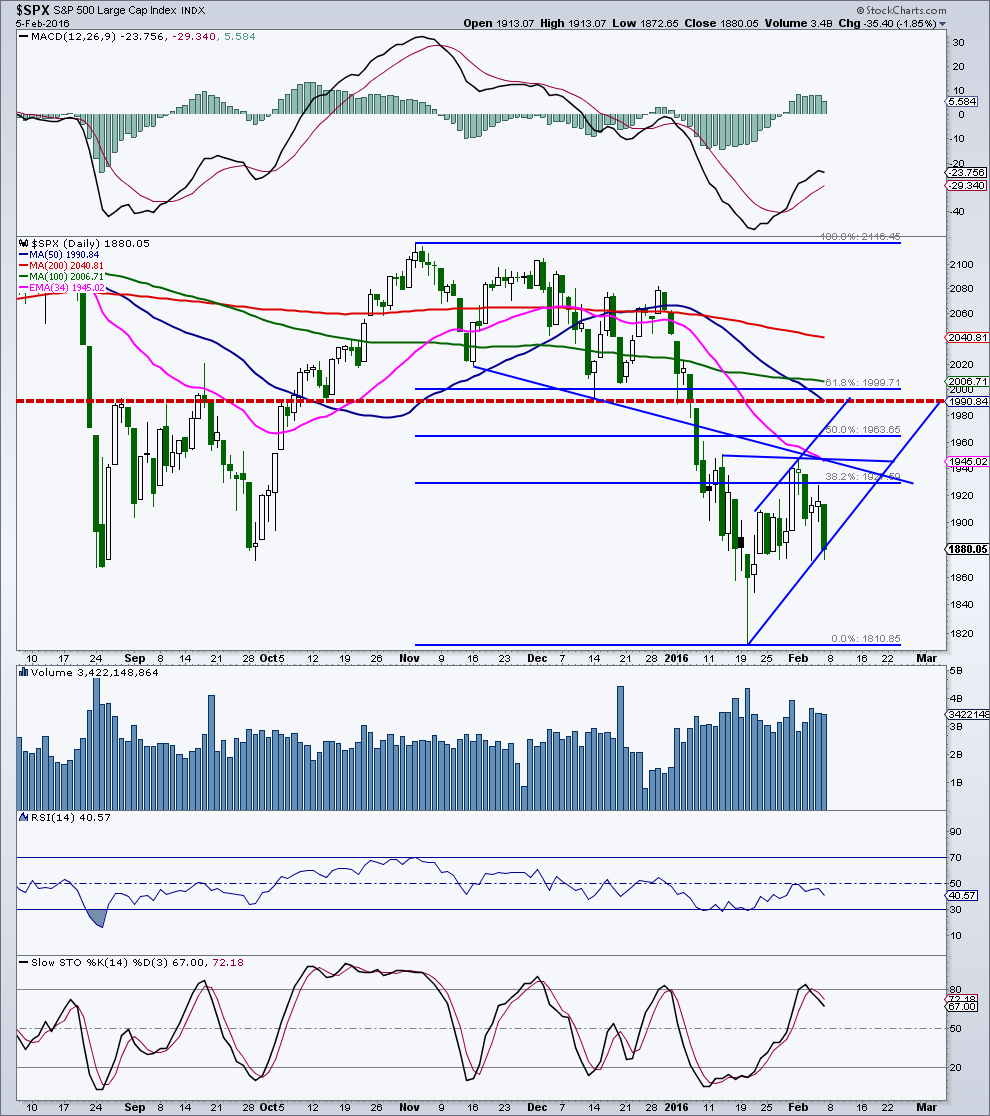
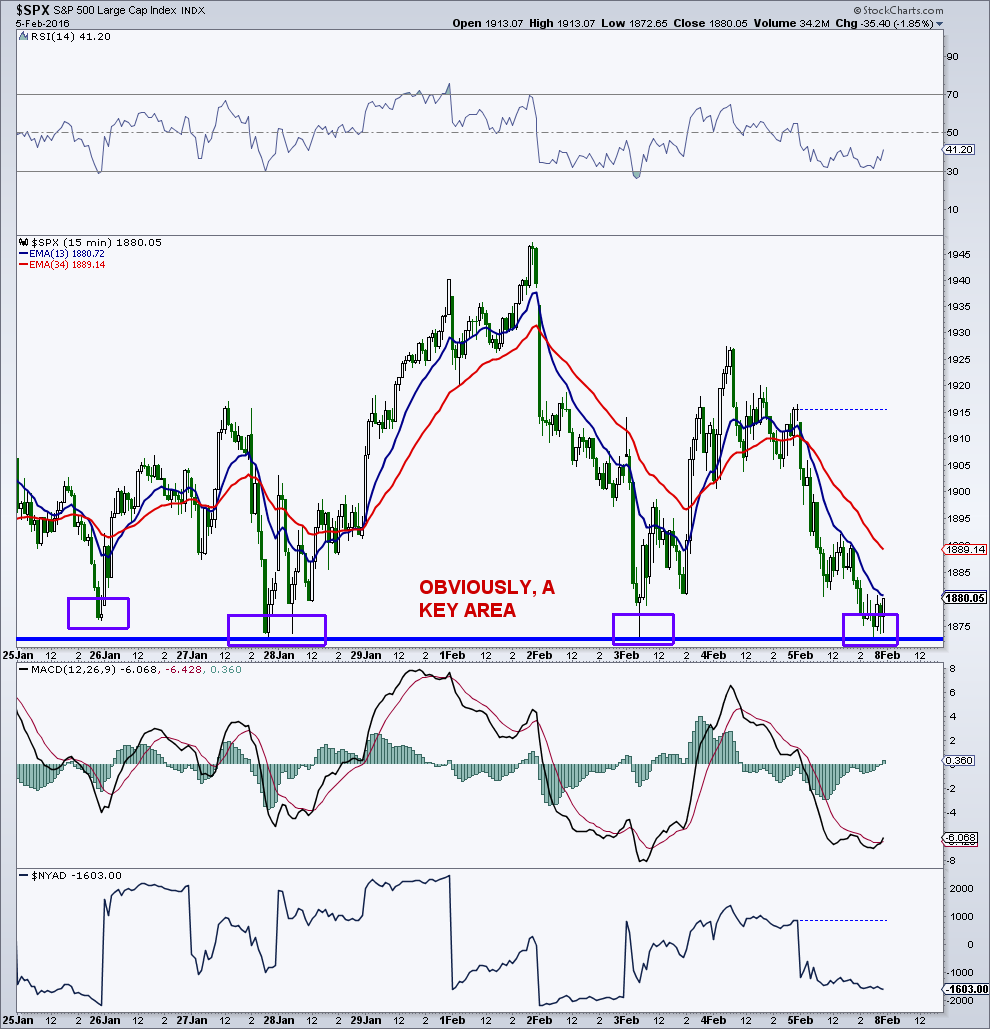
Obviously, this 1,870/1,880 zone for the S&P 500 is at an important juncture.
Heavyweight stocks that have reported better than expected Q4 results (FB, GOOGL) have seen major failures while stocks missing earnings (LNKD, DATA, KSS, RL) have been hammered.
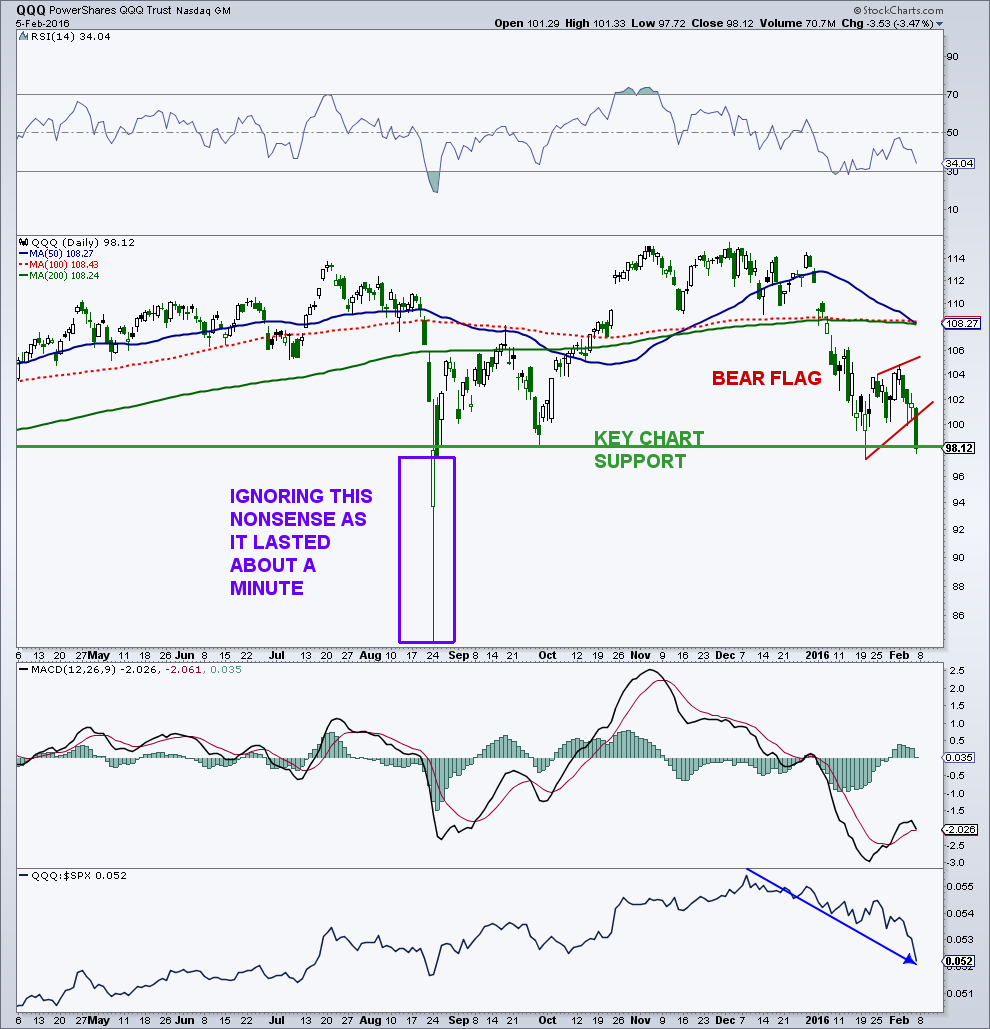
Needless to say, my cautionary note (bear flag) Thursday on the Nasdaq 100 ETF (QQQ) has played out with price now sitting right on the precipice. While on the chart, the candle from August 24 is virtually useless as potential price support (no price structure) as the index traded in the 84 to 94? zone for what, a minute (guess). Obviously, not a consistent area of buying, just a flash in time. So market bulls better make a stand right here and now or those stock market lows may be here soon again.
I’m going into the weekend net short as the price structure of the major stock market indices looks very susceptible to big downside in the coming weeks. The market has much more resistance (overhead supply) then it has chart support down below.
You can contact me at arbetermark@gmail.com for premium newsletter inquiries. Thanks for reading.
More From Mark: Is A Bear Market Rally Underway?
Have a great rest of your weekend!
Twitter: @MarkArbeter
The author is holding a net short position in mentioned securities at the time of publication. Any opinions expressed herein are solely those of the author, and do not in any way represent the views or opinions of any other person or entity.


: Showing Some Signs of Emerging Strength")
