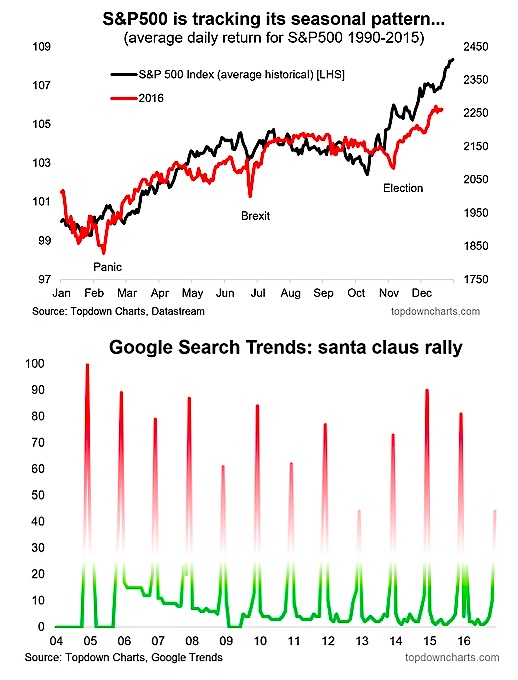
2. S&P 500 Index – “Santa Claus” Status
Stock market seasonality has worked pretty well so far this year, and by the charts there could still be some upside from seasonality alone yet to come with the famous or infamous “Santa Claus rally” potentially in play. The key caveat is that seasonality can break at any moment, and the chart shows some notable deviations from the historical seasonal pattern. As a bonus fun chart for the season, I’ve included Google Search Trends data that show an uptick in interest for the santa claus rally (albeit December is partial data).
Overall technical view: Bullish bias on seasonality.
Next chart (Emerging Markets)…

: Showing Some Signs of Emerging Strength")
