I’m back with another set of 5 macro technical charts to watch (including stock market indices, sectors, individual commodities, currencies, bonds, and other benchmarks and market indicators).
This chart review strictly looks at technical price developments. Even if you’re not technical analysis minded it’s a useful way to keep on top of global market trends in some of the main financial markets. You can also use this as a prompt for further investigation…
Today we look at the Euro (CURRENCY:EUR), the S&P 500 (INDEXSP:.INX), Emerging Markets equities (NYSEARCA:EEM), US Treasuries, and the Commodities sector.
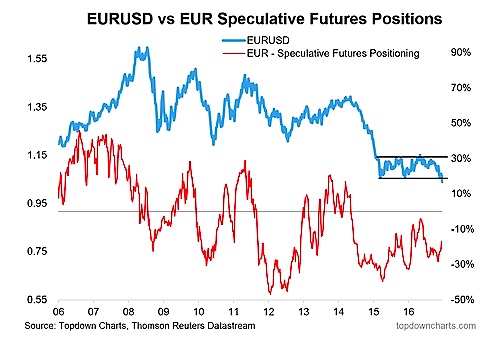
1. Euro (EURUSD) – Broken Rectangle
The Euro has made a downside break of a large rectangle pattern seen on the weekly chart below.
At the same time, speculative futures positioning has come back somewhat, so you wouldn’t say it’s particularly stretched at this point, and thus could go further.
As noted previously, Rectangle patterns, like symmetrical triangles, can act as continuation or reversal patterns… the key is the breakout; the cautionary for EURUSD is there have been a few false breakouts so far; the other point is that a move back toward the top of the range or consolidation zone would be almost a 1000pip move!
Overall technical view: Bearish, but beware of false breakouts
Next chart (S&P 500 Seasonality)…

: Showing Some Signs of Emerging Strength")
