On June 3rd I recorded a 20-minute video for StockchartsTV.
The thesis is to explore whether we are at the beginning of a market correction or gearing up for a summer rally.
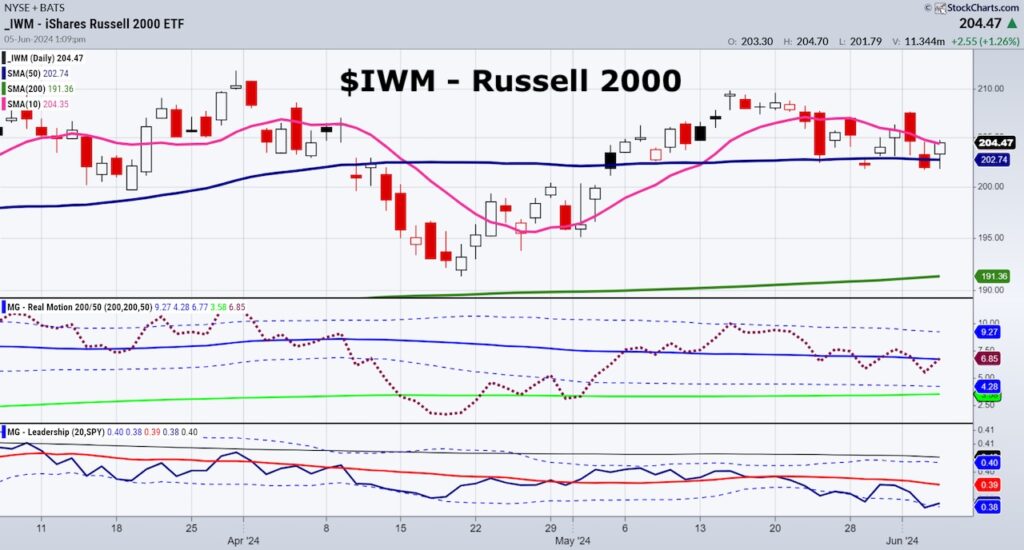
Interestingly, I start with the Granddaddy of the US Economy and our Economic Modern Family-the Russell 2000 (IWM).
Today, not only did IWM hold clutch support, (which I surmise could happen) but I also go through a level the Transportation sector (IYT) has to clear and why long bonds could ultimately send a warning (TLT).
I go on to analyze COIN, PLTR, CANE and KRE among others.
Basically, I share a MACRO view, focusing on price charts and notable outliers.
And then I help you discover where to put your money, no matter the market direction.
I am super proud of this work and of all the comments I got on the YouTube.
Here is a sample:
And wait, there’s more!
Check out the video below:
Table of Contents
00:00 – Intro 01:05 – Russell 2000 ETF (IWM), Transportation Average ETF (IYT)
06:38 – S&P Regional Banking ETF (KRE), 20+ Year Treasury Bond ETF (TLT)
11:34 – iBoxx $ High Yield Corporate Bond ETF (HYG), Nasdaq Biotechnology ETF (IBB)
14:20 – Consumer Staples Sector (XLP)
15:21 – Coinbase Global (COIN), iShares Silver Trust (SLV)
19:09 – Teucrium Sugar Fund (CANE), Palantir Technologies (PLTR)
21:08 – Nu Skin Enterprises (NUS)
Twitter: @marketminute
The author may have a position in mentioned securities at the time of publication. Any opinions expressed herein are solely those of the author and do not represent the views or opinions of any other person or entity.


: Important Breakout Retest")


