As we closely monitor the major equity averages testing their 200-day moving averages from below, we’ve identified three key charts that help illustrate market dynamics in early May 2025.
Microsoft Flashes the “Gap and Run” Pattern
We’re winding down Q1 earnings season, with many S&P 500 companies beating their quarterly earnings estimates. The real story, however, is how many companies are lowering or removing their forward guidance until further notice.
Given the growing uncertainty about the potential impact of new tariff policies, stocks like Microsoft Corp. (MSFT) are even more impressive in their upside price gaps.
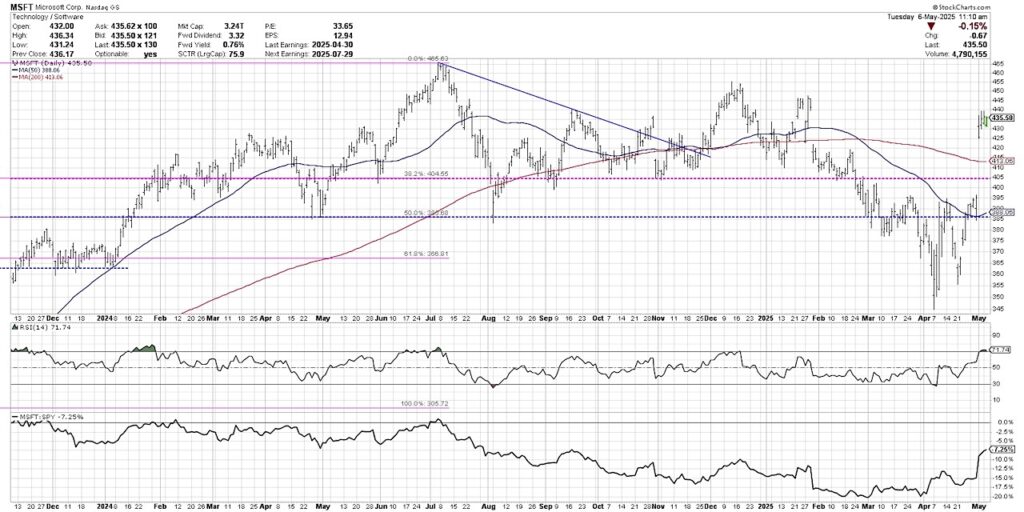
We can see what’s called the “gap and run” pattern on the chart of MSFT, with last week’s gap higher followed by additional buying power. When a stock gaps higher, it’s all about the follow-through. Will additional buyers come in, willing to pay even more for this recently upgraded stock? As long as MSFT holds the upper end of the price gap around $425, the answer is yes.
Bitcoin as a Leveraged Play on Stocks
It’s been suggested that cryptocurrencies like Bitcoin and Ethereum could provide a “safe haven” of sorts when equities are struggling. A quick review of the performance of Bitcoin along with key equity index ETFs shows that cryptos are essentially a leveraged bet on stock performance in 2025.
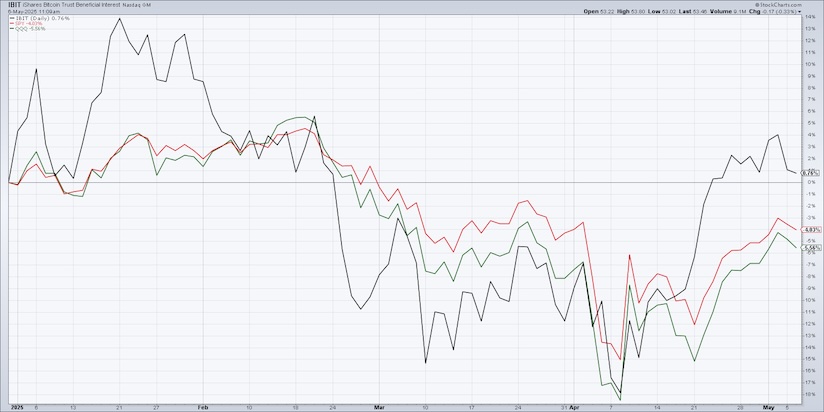
Here we’re charting the year-to-date performance of the iShares Bitcoin Trust Beneficial Interest ETF (IBIT) along with the S&P 500 (SPY) and Nasdaq 100 (QQQ). You’ll see that in January, IBIT was up as much as 14% compared to the S&P’s +4%. Then after the February market peak, Bitcoin underperformed the S&P 500 and Nasdaq 100. Over the last four weeks, IBIT has rallied even more than the equity benchmarks.
It turns out that in 2025, Bitcoin has basically provided a more volatile experience for investors, but not a differentiated return profile from equity index ETFs. So while we can debate the benefits of cryptocurrencies in a diversified portfolio strategy, we can’t pretend that the returns have been dramatically different from stocks!
Gold Strength Suggests “Rocks Over Paper”
Gold experienced a brief pullback in April, after logging an incredible uptrend in Q1. This week, we’re seeing the SPDR Gold Shares (GLD) rotate back to retest its recent all-time high.
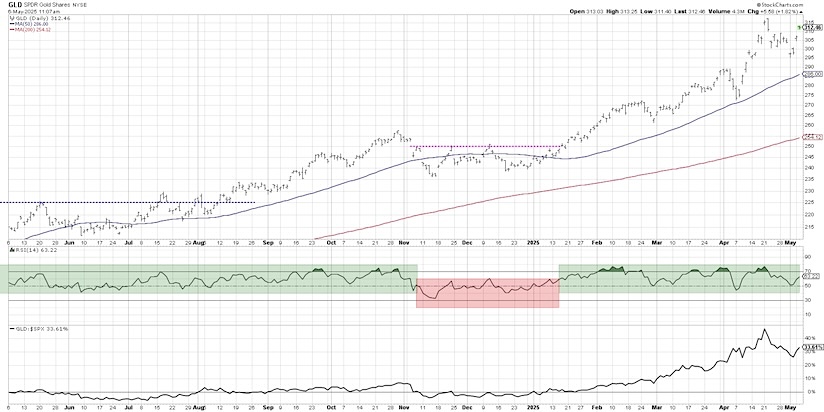
What tells us that gold remains in a primary uptrend? Three things come to mind. First, the price of GLD continues to pound out a pattern of higher highs and higher lows. Second, gold remains above two upward-sloping moving averages. Finally, the RSI has stayed in the bullish range, with pullbacks bringing the RSI no lower than 40. As long as those three characteristics remain in place, we’ll remain bullish on precious metals.
Twitter: @DKellerCMT
The author may have positions in mentioned securities at the time of publication. Any opinions expressed herein are solely those of the author, and do not in any way represent the views or opinions of any other person or entity.


