Market returns in 2017 were rather stellar. The S&P 500 was up 21.8%, while the Canadian TSX finished up 9.1%.
Global markets were also strong from Europe to Asia to Emerging markets – characteristics of a global bull market. We remain in this sweet spot for the market with improving global economic growth and very limited signs of inflationary pressures.
The global economy is really doing well and should carry this positive momentum into 2018. Europe is growing at its best pace since 2011 thanks in part to the region’s greater sensitivity to global growth relative to the U.S. Most emerging economies are expanding handsomely although there are policy rumblings in China. The U.S. economy which led the global economy out of its funk is seeing estimate revision to the upside for the first time in years. Most years, the consensus forecast for the U.S. economy starts out too optimistic and then gets revised down as time passes. Year 2018 consensus forecasts are actually moving higher. Tax reform may garner more media attention, but the underlying U.S. economy continues to be quite strong.
Add this all up and you have consumers and corporations more confident and spending more. Earnings and sales growth are strong. Commodity prices have moved higher on the back of improving global demand and a softer U.S. dollar. Credit spreads have compressed, it is a full risk-on environment. How sweet it is.
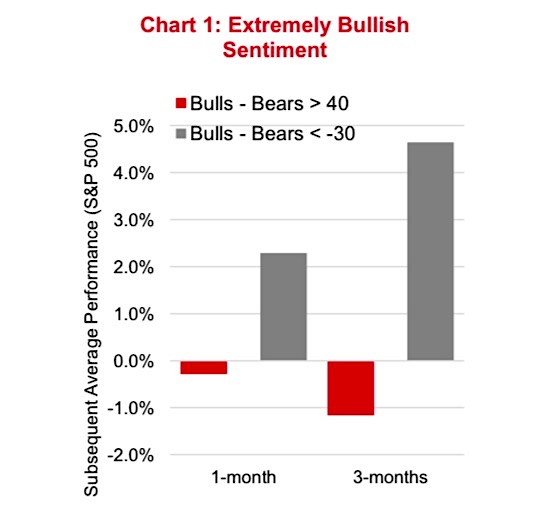
As 2018 begins, we are optimistic for the markets based on the fundamental data, and based on our market cycle analysis (next section), we remain in the view that this bull cycle has more room to run. However, we have two caveats. The first is simply sentiment is extremely bullish at the moment with 60% of investors bullish and only 16% bearish. Typically, when the spread is greater than 20 (60-16=44) equity market returns over the next few months are tepid (chart 1 below).
Clearly a lot of the good news is already reflected in stock prices and it has been a very long time since we saw a correction.
The other caveat is we are seeing more signs of an extended cycle. Fed raising rates, U.S. output gap has closed and narrowing leadership are all becoming evident. These signals are longer term and often precede a bear market by a year or two, but they are starting to show up nonetheless.
Market Cycle – another good checkup
The current market cycle started in early 2009 and is now over eight years old. Based on either global economic growth or duration in between bear markets for the S&P 500 or TSX Composite, the current cycle is one of the longest on record. In our view, there is little doubt based on our analysis that this is a late cycle environment. Most of the characteristics of a late cycle are now clearly evident. The examples are many – elevated valuations in the equity markets, low unemployment, synchronized global economic growth, and narrowing leadership in equity markets – to name a few. Add to this a Federal Reserve that appears set to raise rates three times next year. And the output of the U.S. has just joined Germany and Japan as major economies producing above potential.
We are also starting to see some signs of animal spirits in rising confidence and investor behaviours. One of the late cycle characteristics missing is inflationary pressure, which may hold the key to how long this cycle continues to run and what might signal the end.
The good news is based on our proprietary Market Cycle framework, where we see limited signs that the end of the cycle is near.
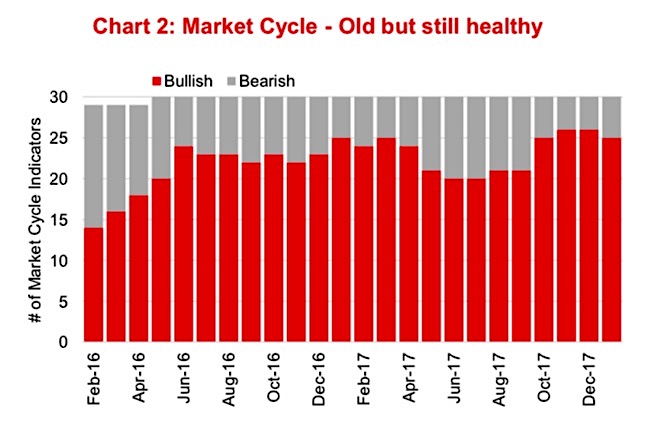
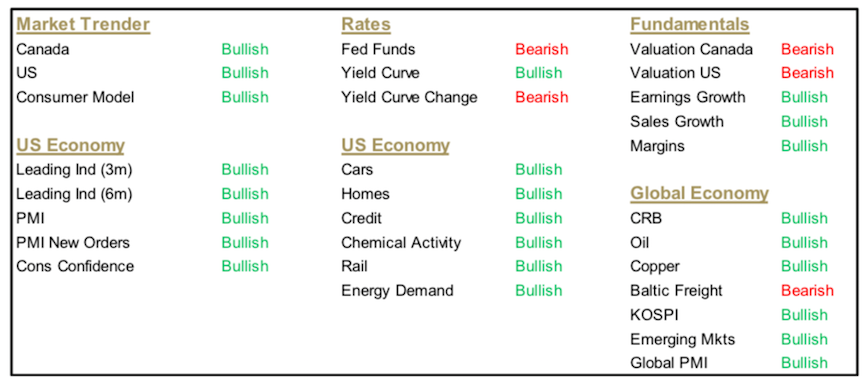
This framework is multidisciplinary, incorporating yields, economic data, company fundamentals, valuations and technical indicators. There are 30 key inputs, and each have been historically accurate, to varying degrees, in signaling turning points in the market cycle. Our view is none will work every time, but using a basket we have a better chance of positioning the portfolio for the most probable next move. The good news is 25 of the 30 remain bullish for the continuation of the current cycle (Chart 2 above and all the individual signals in the table further below). Historically, that is high and healthy. We don’t really get concerned unless the number of bullish signals drops down into the low teens.
How do we see the cycle playing out?
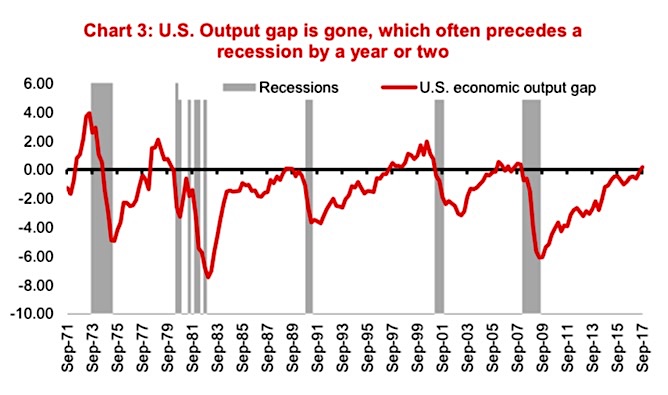
Our base case scenario remains relatively traditional. The global economic growth continues to improve gradually, and this finally begins to translate into inflationary pressure and/or upward pressure on bond yields. Given so much asset price inflation occurred over the past decade thanks to low yields, this asset price inflation partially reverses and causes a recession. The timing of this scenario is not imminent but there are signs it may be coming. The German and Japanese economies have both been producing above their potential, which causes inflationary pressures. The U.S. has just passed over this threshold as well (Chart 3 below). Historically, this precedes recessions by a year or two.
Adding to this base case, the Fed, as mentioned above, is now expected to raise rates three times in 2018 which would put the upper band of the Fed Funds rate at 2.25%. How and when this begins to impact longer term yields will be critical and could begin multiple compression, not just in the equity markets but also in real estate cap rates.
For now, we are in the sweet spot: a healthy economy and low inflation. We will be watching inflation for a potential early warning signal that things may change. If the current relatively low inflation expectations begin to creep higher, this would likely trigger a surprise reaction in the bond market causing higher than expected yields. Some surprises are welcome, but this development would certainly be an unwelcome one. But for now, enjoy the good times.
Charts are sourced to Bloomberg unless otherwise noted.
Twitter: @ConnectedWealth
Any opinions expressed herein are solely those of the authors, and do not in any way represent the views or opinions of any other person or entity.


