Traders, it was a bit dicey at times, but the S&P 500 Futures (ES) forecast correction and support zone have held and prices are now above my long entry levels from August 1st (see end of article).
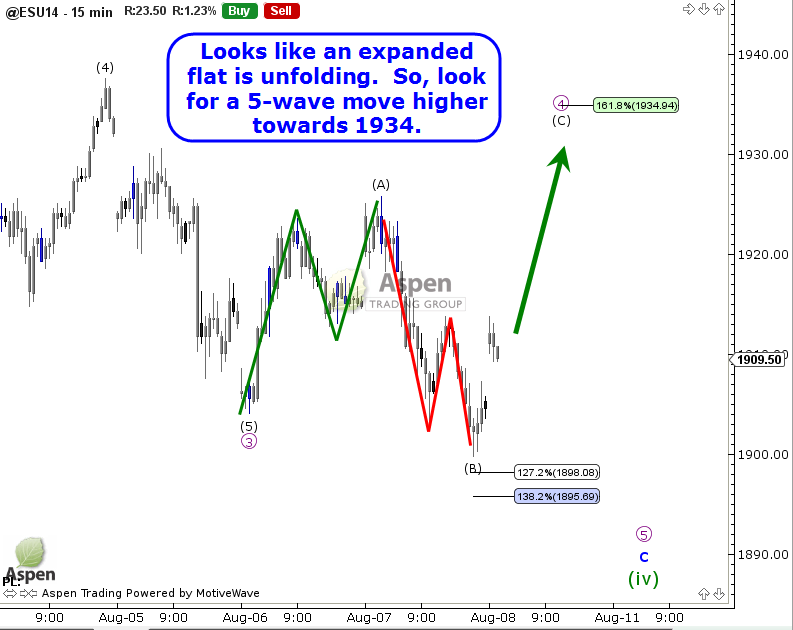
I have updated the chart from Friday and now see a way to label it as a completed move lower in Wave (iv).
Friday’s S&P 500 Futures Chart
Updated S&P 500 Futures Chart / Forecast
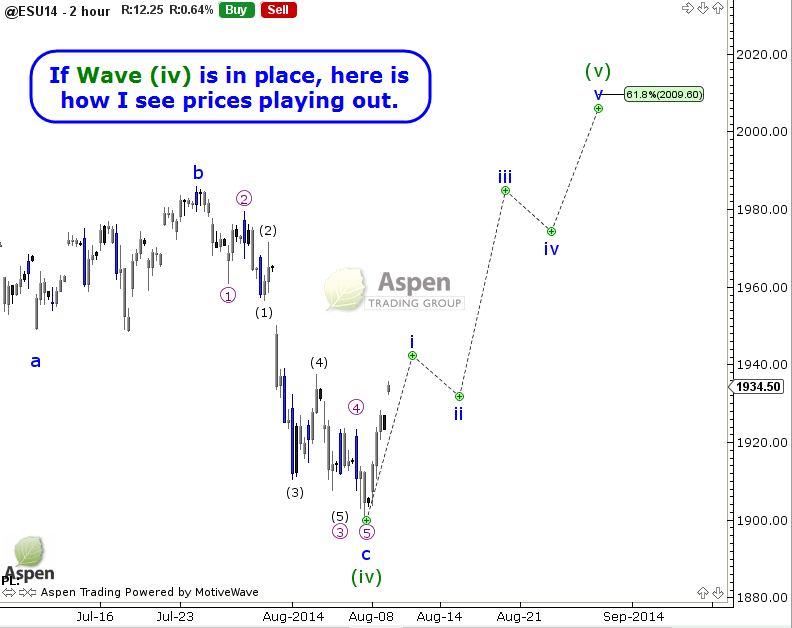
I think this pull-back in the S&P’s might have run its course. I think this pullback is an opportunity to get long. Below are the details for both S&P 500 futures and the ETF.
Original Trade Plan from August 1st (adjusting as necessary):
S&P 500 Futures:
- Go long from current levels – last traded 1928
- Stops at 1885
- Targeting 2016
SPY:
- Go long from current levels – last traded $193.20
- Stops at 190.50
- Targeting $202.50
Follow Dave on Twitter: @aspentrading10
Author has a position in SPY at the time of publication. Any opinions expressed herein are solely those of the author, and do not in any way represent the views or opinions of any other person or entity.
: Worrisome to Broader Market?")

: Important Breakout Retest")