 Following Wednesday’s seventh consecutive close higher for S&P 500 Futures (Symbol: ES), we took a look at how the contract has performed subsequent to that event over the last 10 years. As improbable as it seems when so many green candles pile up, that study showed that half (7 of 14) of those occurrences went on to register at least 1 more up-day before the streak finished.
A close higher Thursday was even money based on that data; but with the wind of positive momentum at their backs the bulls took it, producing an eighth higher close in a row on ES. Here’s a glance at the performance that followed up to 2 months after each of the 9 previous occurrences in the last 20 years.
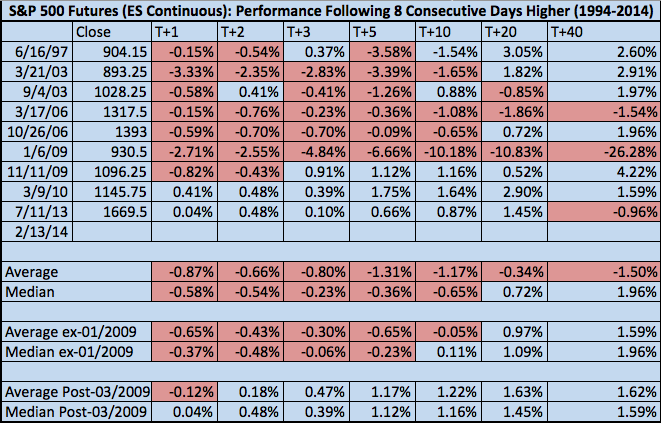
As one might expect, this data follows a similar flow to the results of the “7 Consecutive Days Higher” study: the early-mid 2000s are marked by poor short-term performance, January 2009 suffered the worst performance by far; and 8 day stock rallies during the current cyclical bull (March 2009-present) have held up comparatively well. Here are some additional statistics:
- 1 Day Later: 78% of the time, the next day closes lower. The decline on those days averages -1.19%, or -21.7 points (assuming ES 1825).
- 1 Week Later: 66% of the time, ES is lower a week later. Where it drops, the average performance is -2.56% or -46.75 points.
- 2 Weeks Later: ES is lower only 45% of the time 10 trading days out by an average of -3.39%, or -71.2 points. 2009’s outlying performing begins to exert a heavy influence here: back out its -10.18% performance, the decline averages only -1.13%.
- 1 Month Later: 20 trading days later, ES is up 66% of the time, averaging +1.74% or 31.75 points.
- 2 Months Later: ES is up 66% of the time again, averaging +2.54% or 46.4 points.
There are several additional points to consider here: first, performance favors a negative outcome over the next trading week (e.g. ES has only closed higher 9 days in a row in 2 of 9 occurrences). Second, overall – and especially after the first week – performance steadily improves. In fact, a repetition of the median performance two months into the future puts ES and the broader US stock market again at fresh all-time highs.
Twitter: @andrewunknown and @seeitmarket
Author holds no exposure to instruments mentioned at the time of publication. Commentary provided is for educational purposes only and in no way constitutes trading or investment advice.
Any opinions expressed herein are solely those of the author, and do not in any way represent the views or opinions of any other person or entity.


