 S&P 500 futures (Symbol: ES) just finished their seventh consecutive day higher Wednesday, completing a feat that has occurred 14 times in the previous 10 years.
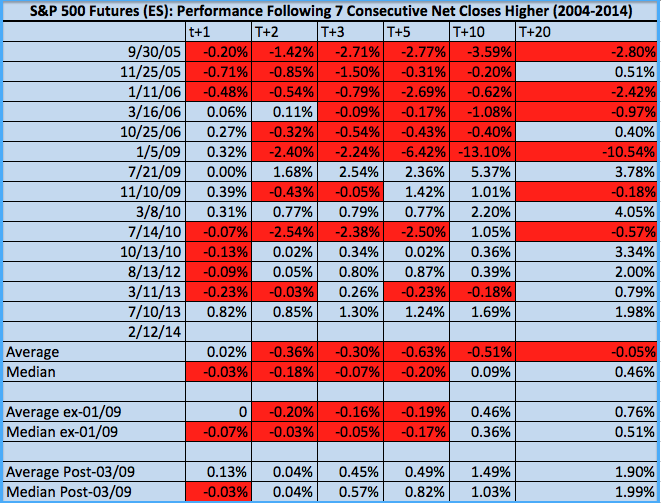
After such a run, the question “Do 7 consecutive net closes higher provide any short-to-medium term edge, long or short?” naturally follows. Fortunately for your time and mine, the answer is a qualified “yes”. To find out just what that means, let’s first review these occurrences and their subsequent performance in the table below:
Here are a few preliminary observations:
- Though incidence of 7 or more consecutive sessions higher is unusual, with an occurrence every 8.5 months on average they are hardly rare.
- 7 of 14 or 1/2 of the sessions in the last 10 years went on to add at least one additional consecutive session higher. These occurrences are indicated by blue-shaded boxes in the “t+1 column”.
- Average and median subsequent returns are flat-to-negative across every interval when considering the entire series.
- Stripping out January 2009’s outlying negative performance (this occurrence begins in the second session of January-March 2009’s -24.9% from 900 to 676), returns dip from 2-10 trading days, but improve 10-20 trading days (15-30 calendar days) out.
- Skipping the “housing boom” passage in the series to take only those occurrence following March 2009, average and median returns are uniformly positive across all intervals.
As it turns out, occurrences of 7 consecutive net closes higher provide negligible-to-no edge when considering the entire series. The picture does improve for the long side where early 2009’s crisis outlier is removed, even if the returns at 10-20 days out are remain modest.
Elsewhere: though 2005-2006 were hardly difficult years for the S&P, the 5 of 14 occurrences then had almost entirely negative subsequent performance. In curious contrast, 2009-2014’s cyclical bull has produced positive performance across every interval, predictably improving as the timeframe extends in line with the prevailing up trend. As the table shows, on average during this period following 7 higher closes in a row the S&P futures have traded higher by +0.5% a week later, +1.5% 2 weeks later, and nearly +2% a month later.
Even though “7 consecutive sessions higher” sounds like redlined upward momentum or an overheating bull run to the untrained ear, historic returns have actually been lackluster for both sides of the directional coin. In a more recent context (5 years) however, a defined short-term bullish edge is evident.
Twitter: @andrewunknown and @seeitmarket
Author holds no exposure to instruments mentioned at the time of publication. Commentary provided is for educational purposes only and in no way constitutes trading or investment advice.
Any opinions expressed herein are solely those of the author, and do not in any way represent the views or opinions of any other person or entity.


