Maybe I’m showing my age, but it does not seem like that long ago when politicians were bashing big oil and market speculators for driving up energy prices.
The time was early 2008 when West Texas Intermediate Crude Oil skyrocketed to nearly $150 a barrel.
This was shortly before the height of the financial crisis.
Today, some in the political establishment are once again taking aim at the oil companies, but this time for being seen as major contributors to climate change and global warming.
Breaking news – oil companies are never viewed as the do-gooders of the world. Some things never change.
What has changed though is the market.
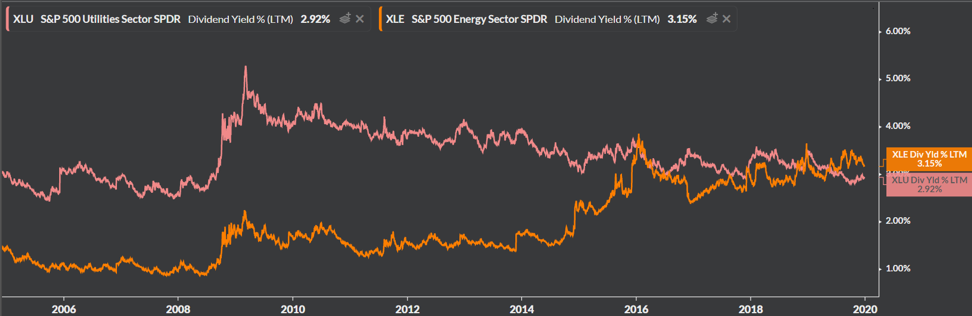
The Energy Sector ETF (XLE) now sports a higher dividend yield than the Utilties Sector ETF (XLU). This is a remarkable turn of events as utilities are known to be the safe-haven of equity sectors for their stable and reliable cash flows from power and electricity customers.
But these aren’t your grandmother’s utilities anymore. NextEra (NEE) is more than 13% of the sector, and the Florida-based company is known to be a major developer of renewable energy. Nextera is just one holding that is no longer focused on simply producing fossil-fuel generated power and delivering it to their customers. Green energy and technology is a major facet of XLU as we get ready for life in 2020s. Perhaps the excitement is priced-in as Nextera has returned nearly 120% to shareholders in the last 3 years.
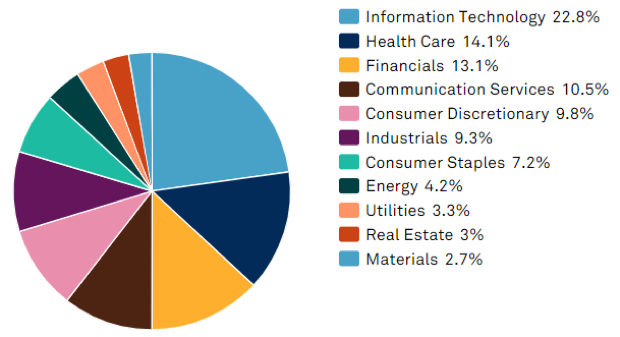
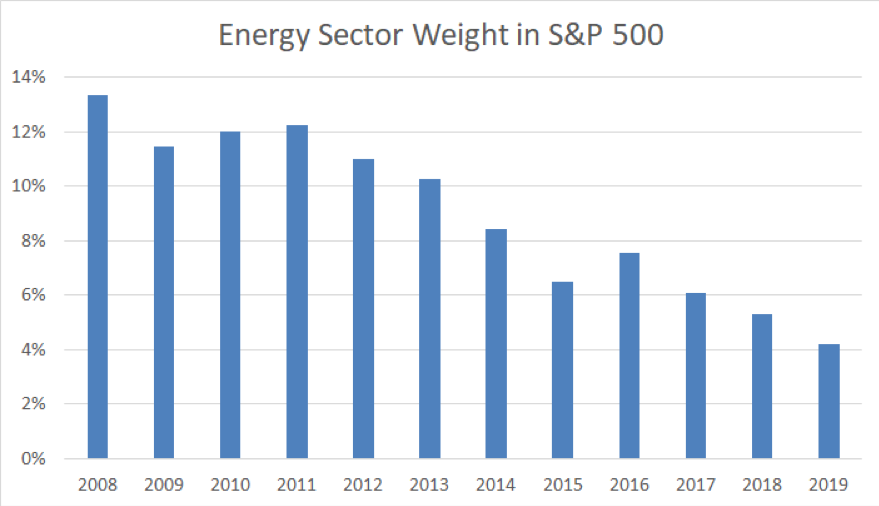
It would not take much for utilities to surpass energy for larger share of the S&P 500. Energy is now just 4.2% of the index versus 3.3% of utilities. The chart below is from S&P/Dow Jones Indices data.
It has been a remarkable fall from grace for the energy sector, once one of the largest sector weights in the US stock market. When will things turn around? I wish I had the answer. But the CMT is me does not want to fight this trend just yet.
I am a Chartered Financial Analyst (CFA) and Chartered Market Technician (CMT). I have passed the coursework for the Certified Financial Planner (CFP) program. I look to leverage my skills in an hourly-fee consultant role for financial advisors – that could be portfolio analysis, planning, writing etc. Please reach out to me at mikeczaccardi@gmail.com for more information. Connect on Linkedin.
Twitter: @MikeZaccardi
The author may hold positions in mentioned securities. Any opinions expressed herein are solely those of the author, and do not in any way represent the views or opinions of any other person or entity.


