The stock market remains fairly volatile with most of the price gyrations to the upside of late. As I have written many times, intermediate- to long-term market tops and bottoms are volatile affairs. It’s a battle between bulls and bears, weak hands and strong hands, and the accumulators and distributors.
This is not much different than the battle between two football teams duking it out for field position in a tight, defensive battle. Sooner or later, someone scores. The bears had the ball, but once again gave it up on downs. The bulls are now in position to take it down the field. At least in the short term and at least for a field goal.
On Monday, February 22, the S&P 500 ($SPX) rallied right up to the intervening high (1,947) of the potential double bottom. I say potential because it’s not officially a double bottom until price breaks out above this high. Following a small pullback which filled one of the gaps from last week in the 1,897 area, the “500” reversed sharply on Wednesday. That rally was accompanied by a huge improvement in market breadth (advance/decline) intraday and once again has the bulls knocking on the door of chart resistance at 1,947. In addition, the S&P 500 is setting the stage for an underside test of the declining 50-day simple moving average at 1,945.
I think the S&P 500 will break through this moving average and chart resistance region and this will be important for a number of reasons. First, many traders, hedge funds, and institutions use the 50-day average as kind of marker to be bullish or bearish the stock market. It’s like an intermediate-term line in the sand. If stocks are above the 50-day, get bullish, and below, stand clear.
S&P 500 Index – Daily Chart
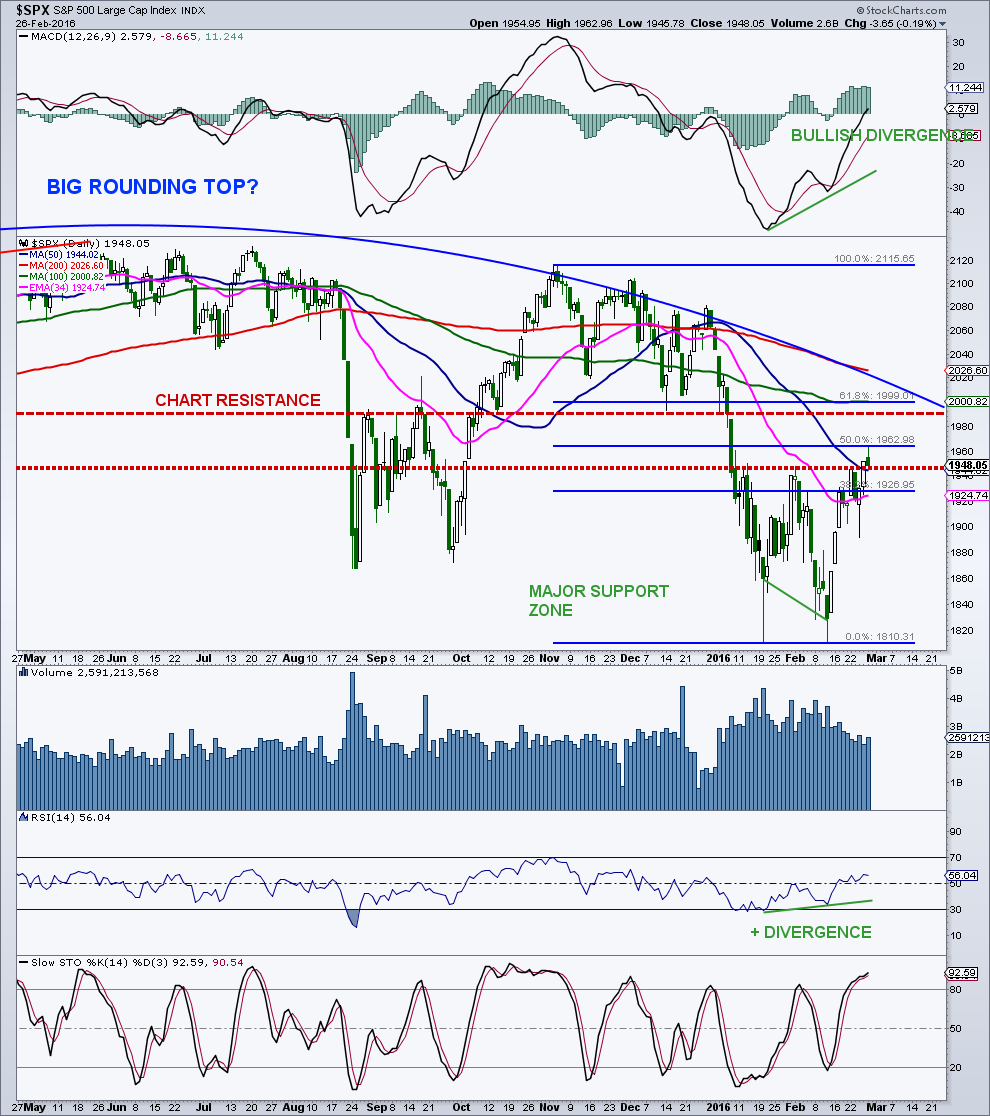
Secondly, it will complete the double bottom formation and open the door for higher levels. There are a couple of pieces of resistance above 1,947 that I have talked about in recent weeks with the first being a 50% retracement of the decline since early November and that targets the 1,963 area. This area may cause the “500” to pause, but I don’t think it will have much significance.
The bigger resistance lies up in the 2,000 zone for the S&P 500. Longer-term, this region may represent the battle ground for whether this is just a bear market rally or that this is just one major consolidation, within a stealth bear market, where the mega cap indices romp to new highs. I am still leaning that this is bear market rally and new lows will be seen later this year.
The 2,000 area on the “500” is important for a number of reasons. It represents an area of strong chart resistance or where buyers stepped in and bought the market and are now sitting with losses. When you make a mistake, and are on the losing side of a trade, breaking even on that purchase is the goal, therefore, a lot of overhead supply sits in the region. In addition, a 61.8% retracement of the decline sits in this zone. The flattening 100-day average comes in at 2,000 while the declining 200-day sits up at 2,027 and will most likely be closer to the 2,000 area looking out into March and April. Last, but not least, and I finally figured out how to draw a curved line on stockcharts.com, the rounded top line comes in near 2,000 when projecting out to March and April.
Another way to look at his key area for the S&P 500 is to break the chart up into areas where institutions were distributing stock and areas where they were accumulating stocks. This is a bit subjective, but bear with me. Pun intended. The initial top for the “500” was generally between 2,000 and 2,135, and therefore, that represents an area of distribution. Since October 2014, there have been five main moves down toward the 1,800 area, with the last two declines clearly showing accumulation between 1,800 and 2,000. So the battle lines have been drawn between those accumulating and those distributing stocks. Quite frankly, many of the sellers above 2,000/2,100 may have been the buyers below 1,900/1,850.
S&P 500 Index – Weekly Chart
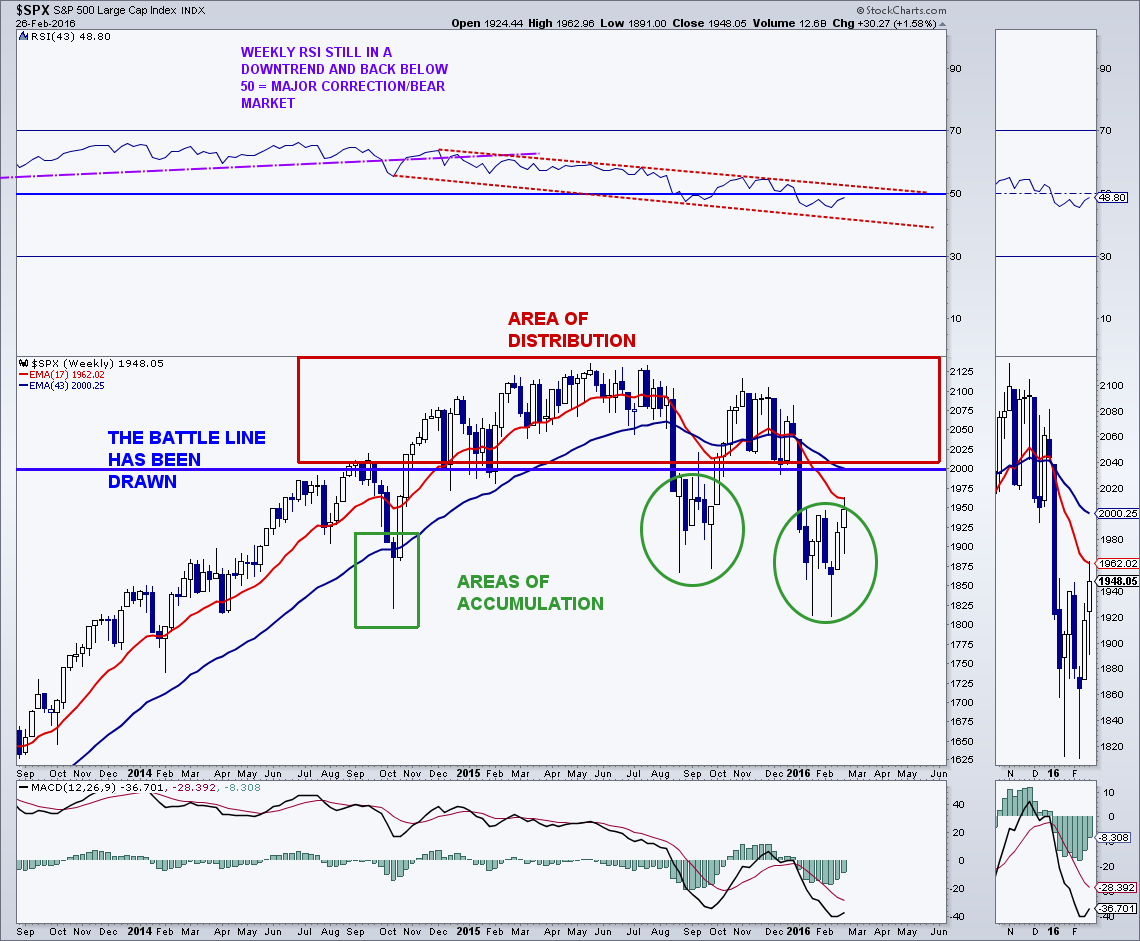
And, one more thing about completing the double bottom on the “500.” A measured move, based on the size of the bottoming or reversal formation (1947 – 1811 = 136 points) equates to a measured move up toward the 2,080 area. Now that would be one bear market rally. Before I get ahead of myself, let’s let the “500” deal with 1,947, 1,963, and the 2,000 levels first.
This is part of Mark’s “On The Mark” newsletter that was published Thursday afternoon. The charts were updated after Friday’s close. You can contact me at arbetermark@gmail.com for premium newsletter inquiries.
Read more from Mark: “S&P 500 Technical Update: Holy Upside Reversal Batman!“
Twitter: @MarkArbeter
The author has a position in the mentioned securities at the time of publication. Any opinions expressed herein are solely those of the author, and do not in any way represent the views or opinions of any other person or entity.

: Showing Some Signs of Emerging Strength")
