In this week’s investing research outlook, we analyze the technical setup and trends of the S&P 500 Index (INDEXSP:.INX) and Nasdaq Composite (INDEXNASDAQ:.IXIC), check in on investor sentiment and market breadth indicators, and discuss emerging themes and news that we are watching closely in our investing research.
Here’s a summary of our findings for the week ending August 11, 2017:
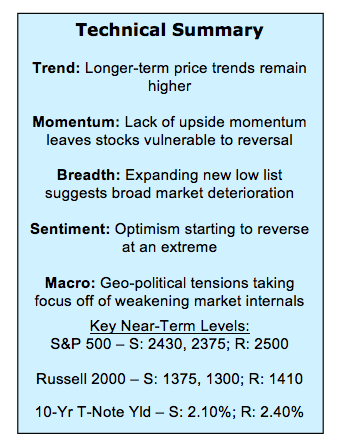
Breadth Deteriorating as New Low List Expands – While the major stock market indexes have been able to largely hold steady (until Thursday at least), conditions beneath the surface have been deteriorating. The S&P 500 spent much of the past 3 weeks closing between 2470 and 2481 as sector-level trends weakened and the new lows list steadily expanded. This all gave way on Thursday as the major stock market indexes dropped over 1 percent.
Optimism Reversing from Extreme – Not every tick in the sentiment data warrants a contrarian stance, but when sentiment reverses at an extreme, it usually pays to take a contrarian position. Right now we have seen excessive optimism across a number of indicators, and that optimism is now starting to reverse. This was seen this week as bulls on the Investors Intelligence survey edged lower and active investment managers trimmed their equity exposure.
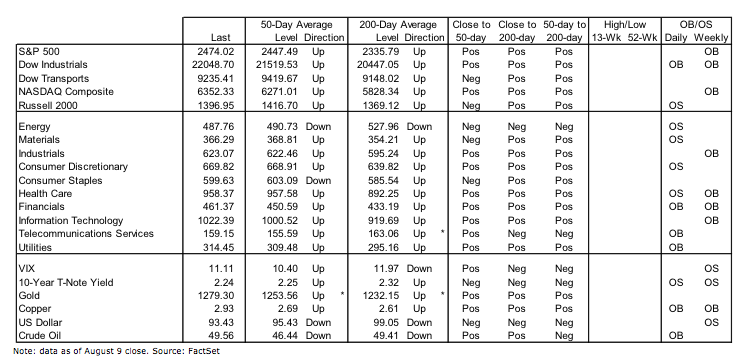
Watch for Defensive Leadership – Treasuries are catching a bid, sending the yield on the 10-year T-Note back toward 2.2%, and the Utilities sector has perked up in our relative strength rankings. We are also watching gold for evidence that investor risk appetites are being pared back.
Stock Market Indicators
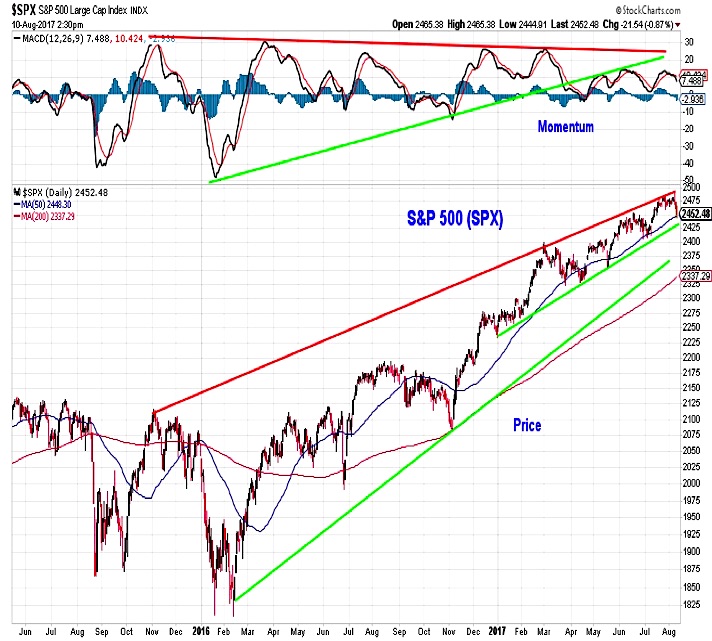
S&P 500 Index
Even though the S&P 500 had been able to consolidate just below its all-time highs (and in fact hit a new all-time high on an intra-day basis earlier this week), the momentum backdrop continued to deteriorate. The failure to accelerate to the upside has left the index to the pullback that is now being seen. Support near 2430 could soon be challenged, and if that fails to hold, the 2350-2375 area could be the next meaningful support level.
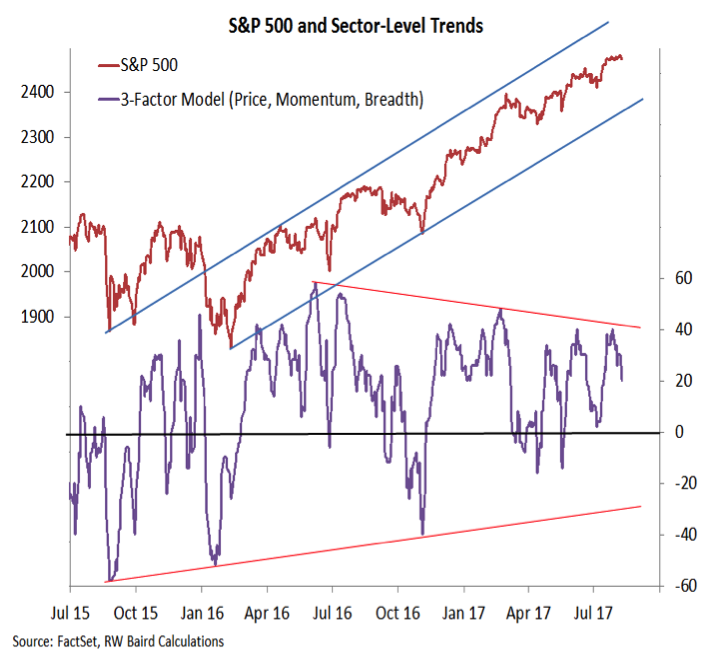
It is not only index-level momentum that has deteriorated as the S&P 500 has consolidated. Short-term sector-level trends have also weakened. This indicator looks at price, momentum and breadth trends at the sector level and while the S&P 500 has moved sideways, this indicator has failed at resistance and is now moving lower. This is supportive of the view that index-level weakness is not strictly a reaction to geo-political tensions (even if that provided the initial impetus for selling).
Nasdaq Composite
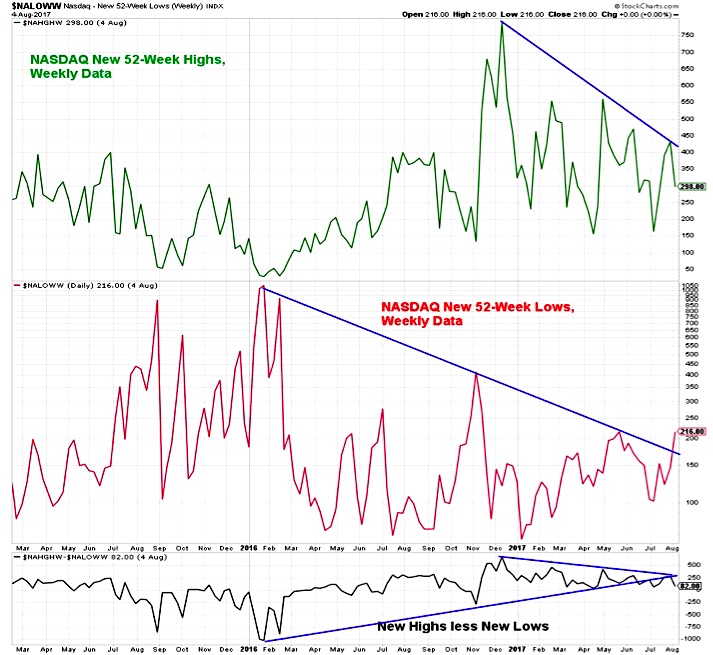
Similarly, the new weekly new low list for the NASDAQ spiked higher last week – prior to this week’s news from the Korean peninsula. The new high list has been getting narrower over the course of 2017, but last week saw a spike in new lows – the most since November 2016 and enough to break above the down-trend in new lows that stretches back to early 2016. The spread between new highs and new lows has seen a similar deterioration.
Investor Sentiment
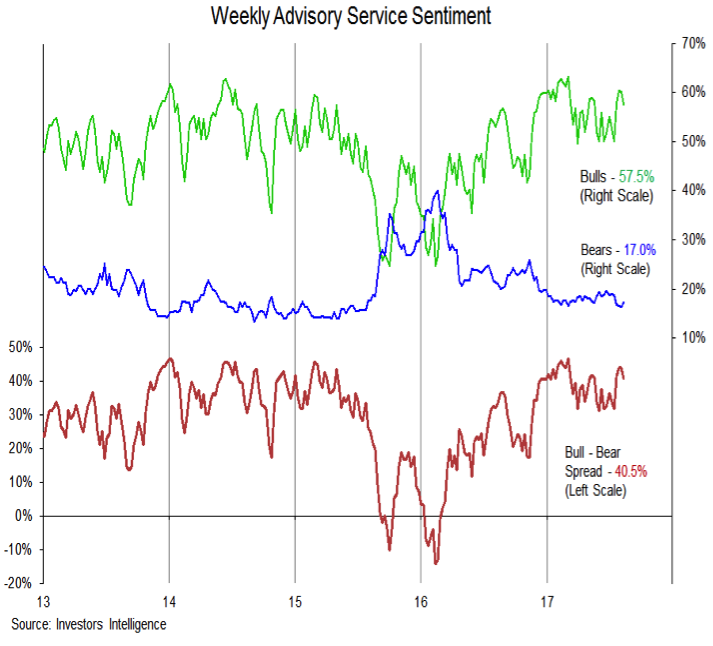
This week’s Investors Intelligence data shows that bulls among advisory services ticked lower last week and bears have ticked higher. This reversal from an optimism extreme leaves stocks vulnerable to more weakness. The NAAIM exposure index was also lower this week (dropping from 93% to 84%). Sentiment is a headwind for stocks when optimism is waning after becoming excessive – that appears to be the case right now.
continue reading on the next page…
: Creating Bullish Divergence?")


 and Semiconductors (SMH): Concerning Price Pattern?")


