In this investing research note, we will analyze key stock market indicators, consider the health of the S&P 500 Index (INDEXSP:.INX), and discuss emerging themes that we are watching in our investing research.
Here are some summary highlights:
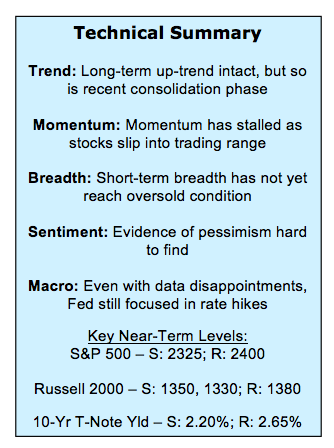
Sentiment Shifts Slow to Materialize – Excessive optimism has been slow to unwind in the sentiment surveys, and evidence of deep-seated pessimism has been even harder to find. In the wake of an optimism extreme, declining optimism and slowly building pessimism are headwinds for stocks.
Broad Market Trends Cooling – Selling pressure has not been sufficient to move shorter-term breadth indicators into oversold territory, but the ongoing consolidation has weakened longer-term breadth trends. For now, these longer-term trends remain a source of support for popular averages
Looking to Broker/Dealers and Transports for Leadership – The cyclical bull market remains intact and an undue focus on a climactic selling event could raise the risk of missing evidence that the consolidation ended with a whimper rather than a bang. Sustained improvement in the Broker/Dealers and/or Transports could be evidence that the rally is resuming. An expansion in the number of issues making new highs would be further confirmation of such a development.
Stock Market Indicators
Investor Sentiment
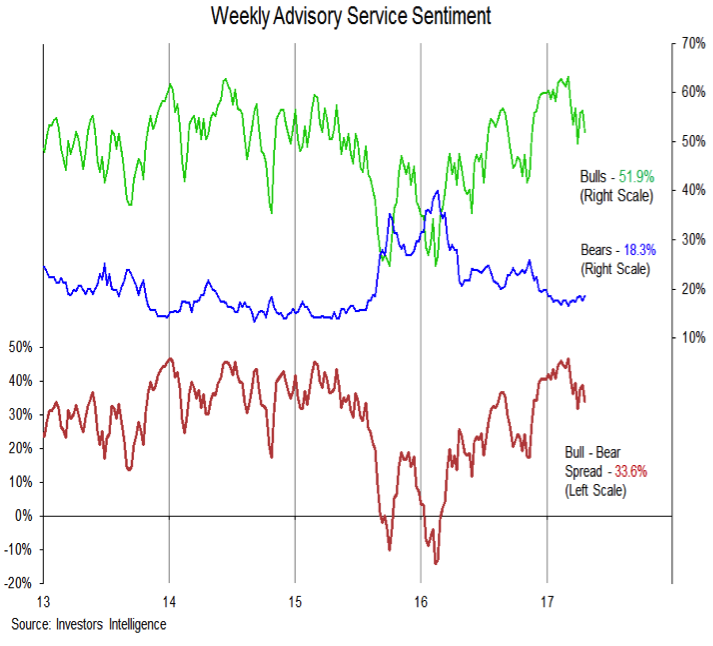
The excessive optimism in short-term sentiment, as measured by the NDR Trading Sentiment Composite, that was present at the beginning of the year has now flipped to excessive pessimism. Evidence of excessive pessimism is still lacking, however, when looking at the weekly sentiment surveys. The Investors Intelligence survey of advisory services still shows bulls above 50% and bears below 20%. The NAAIM exposure index dropped this week as activity managers reduced equity exposure, but at 70% it hardly indicates widespread concern.
Market Breadth
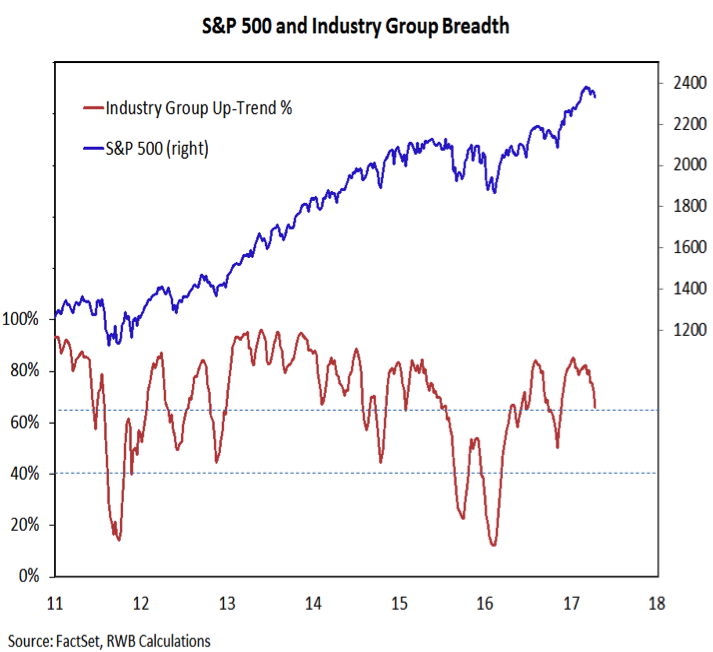
We continue to see longer-term breadth as bullish but the deterioration in industry group trends as accelerated in recent weeks. While 65% of industry groups are still in uptrends, further weakness in this indicator could result in a downgrade in our overall view of broad market trends.
S&P 500 Chart – Trend Analysis
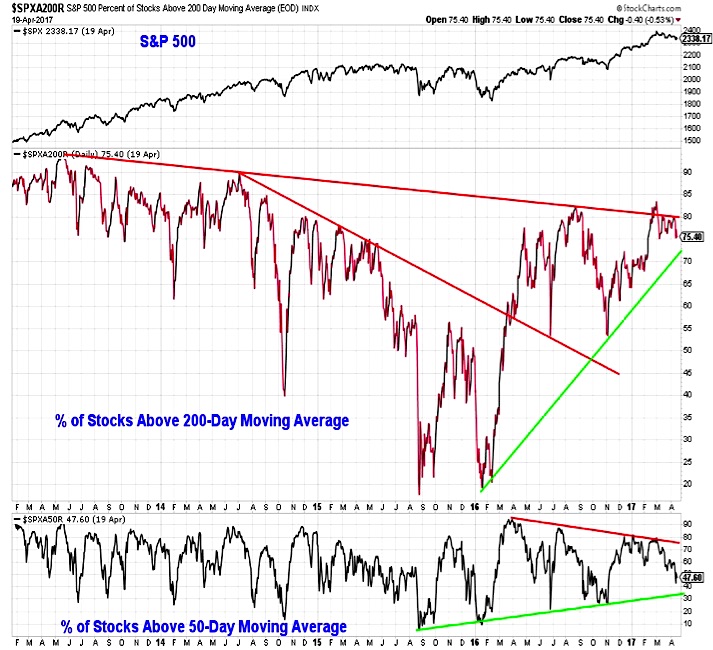
The reset in short-term breadth indicators we discussed a few weeks ago has slowly emerged. The percent of stocks in the S&P 500 that are trading above their 50-day averages has slipped below 50% and could be heading toward support closer to 30%. The percentage of stocks in the index that are trading above their 200-day averages remains near 75%. As with the industry group trend indicator, this indicator is close to arguing for a more muted view with respect to longer-term breadth trends.
Simply put, the ongoing consolidation has proceeded to slowly move short-term breadth trends into oversold territory and has lasted long enough to potentially weaken long-term breadth trends.
continue reading on the next page…

: Showing Some Signs of Emerging Strength")

