In this week’s investing research outlook, we examine current trends for the S&P 500 Index (INDEXSP:.INX) and Russell 2000 (INDEXRUSSELL:RUT), while checking in on stock market breadth and investor sentiment indicators. We’ll also discuss current themes and news that we are watching in the financial markets.
Here’s our summary of our findings for the week ending November 10, 2017:
Rally Getting Ragged – The S&P 500 has continued to drift higher, although intra-day volatility has picked up in recent weeks. More trouble however, seems to be lurking beyond the headlines. Both the small-cap Russell 2000 and the Dow Transports have lost a step, losing ground since peaking in early October.
New High List Narrowing as New Low List Expands – Our longer-term stock market breadth indicators show relatively little deterioration in the underlying trends, but short-term measures reflect a rally that is out of sync. The percentage of stocks trading above their various moving averages is declining. While the S&P 500 continues to make new highs on a weekly basis, the number of stocks moving to new highs has contracted (while those making new lows is expanding).
Dollar Bounce Approaching Resistance – The U.S. Dollar has moved sharply higher since bottoming in September. While short-term momentum for the dollar has improved as the rally has progressed, the longer-term trend in momentum is little changed. Now the dollar rally is running into resistance at the downtrend line that emerged as the index made a series of lower highs earlier this year.
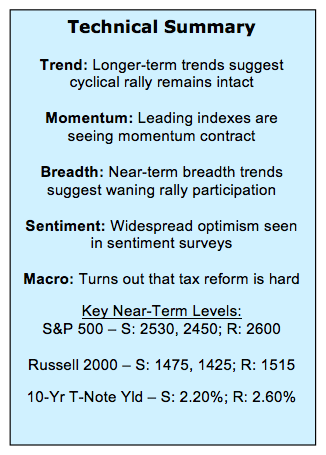
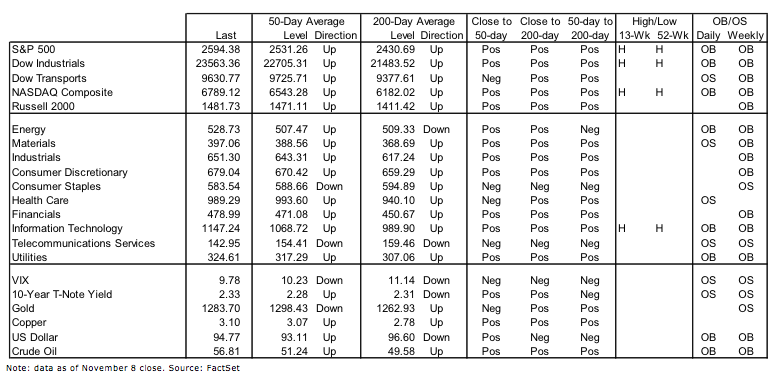
Stock Market Indicators – November 10
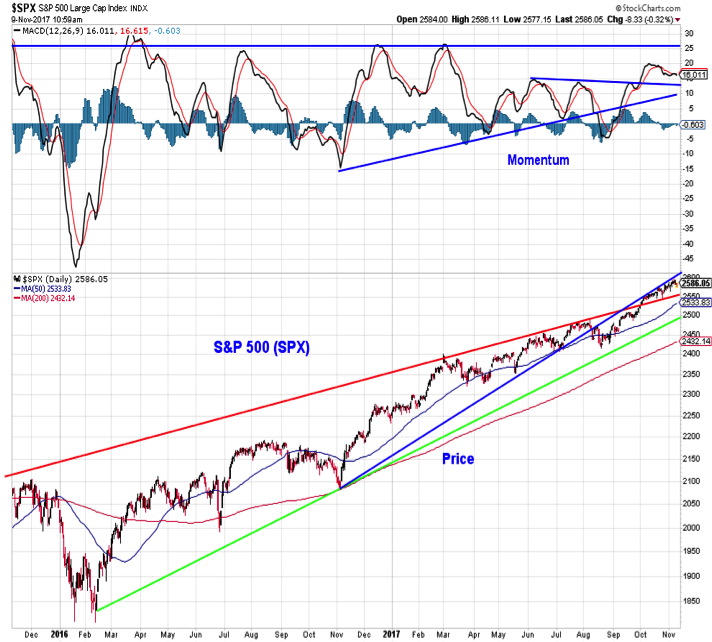
S&P 500 Index
The S&P 500 has remained resilient, closing higher (at new all-time highs) for eight weeks in a row. While the index has rallied off of its August lows, it has not been able to clear trend-line resistance. More recently momentum has begun to cool. It is too early to draw a big conclusion from this price action. The rally off of the 2016 lows has been marked by periods of muddling followed by a brief surge in strength. There is little so far to suggest this has changed.
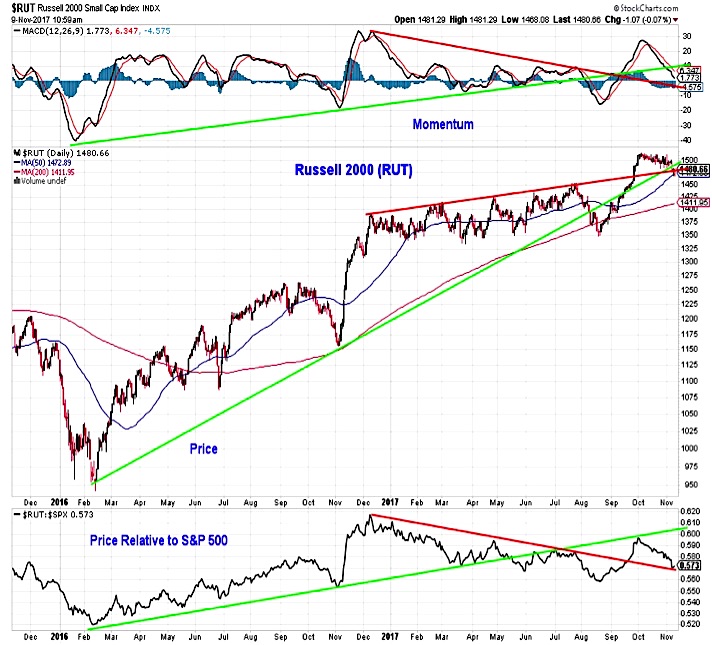
Russell 2000 Index
Small-caps were the darling of the market for a six-week stretch from mid-August to early October (during which time the Russell 2000 rallied 11%). Since then, however, the Russell 2000 has lost ground on both an absolute and relative basis and momentum has deteriorated. Small-caps historically rally into year end, so they may be playing possum right now, absorbing the late-summer rally before turning higher later this month. A failure to do so could be telling.
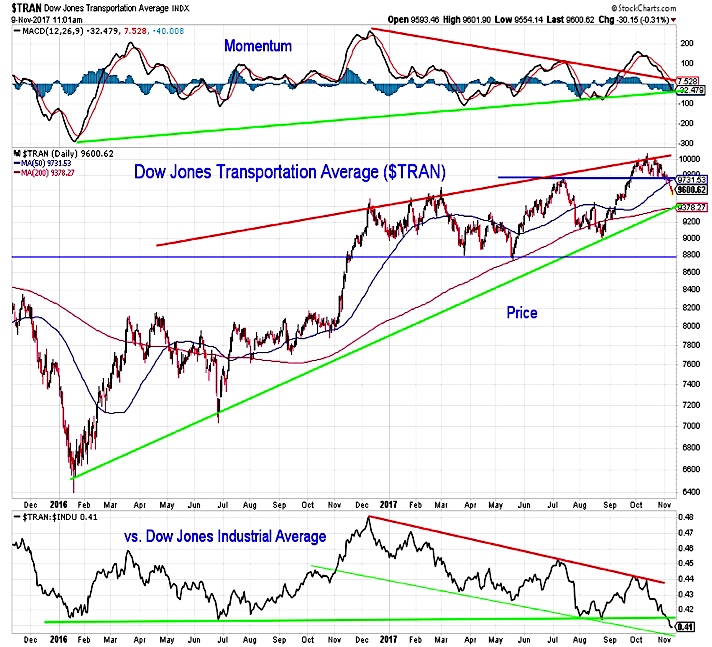
Dow Transportation Index
Similarly, the Dow Transports have turned lower on an absolute and relative basis (versus the Dow Industrials) after running into resistance in October. The 50-day average for the Dow Transports has been broken, and now longer-term trends lines on both a price and momentum basis are being tested.
Market Breadth
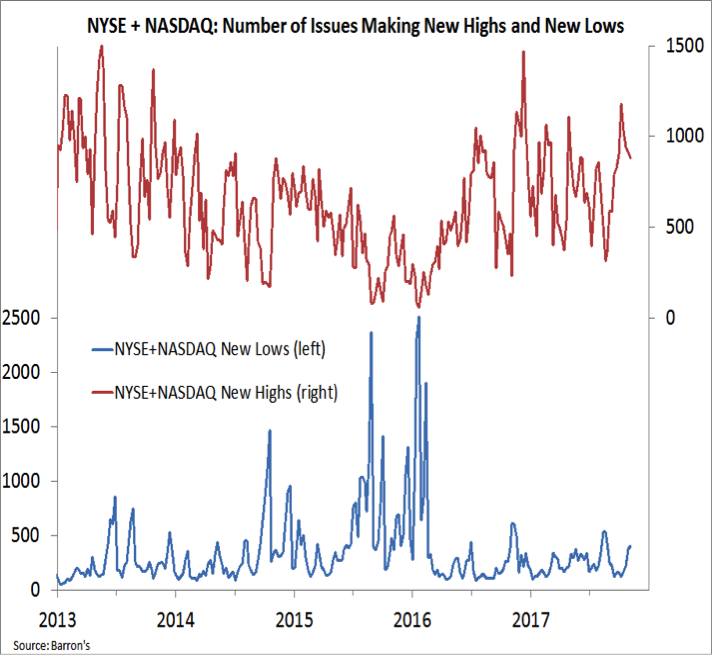
While the S&P 500 has made new closing highs for eight weeks in a row, it is finding less company to join in the celebration. Weekly new highs on the NYSE + NASDAQ ( INDEXNASDAQ:.IXIC)have fallen in each of the past four weeks, while the new low list has expanded in each of the past four weeks. The number of stocks making new highs remains well-above the August low (and the number making new lows is still shy of its August peak), but the lack of confirmation of new index-level highs is becoming more pronounced.
continue reading on the next page…


