Investor sentiment cont.
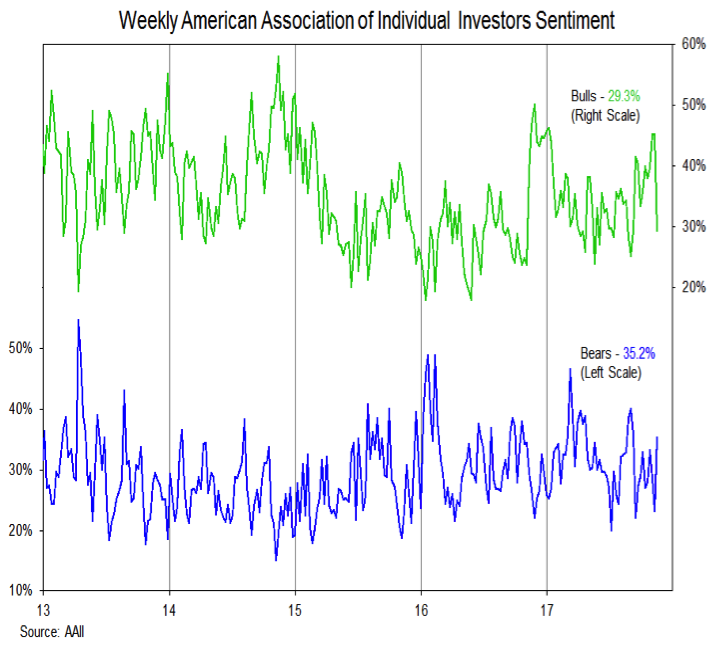
The AAII data had been moving toward excessive optimism as well. Coming into this week, Bulls were at their highest level of the year and Bears had dropped from 33% to 23% over the preceding two weeks. This week brought an abrupt change – Bulls dropped from 45% to 29% and are now outnumbered by bears (35%). We can tease about the fickleness of the AAII survey respondents and question the usefulness of the data but it does echo the shift seen in recent weeks in the Ned Davis Research (NDR) Trading Sentiment Composite – more on that below.
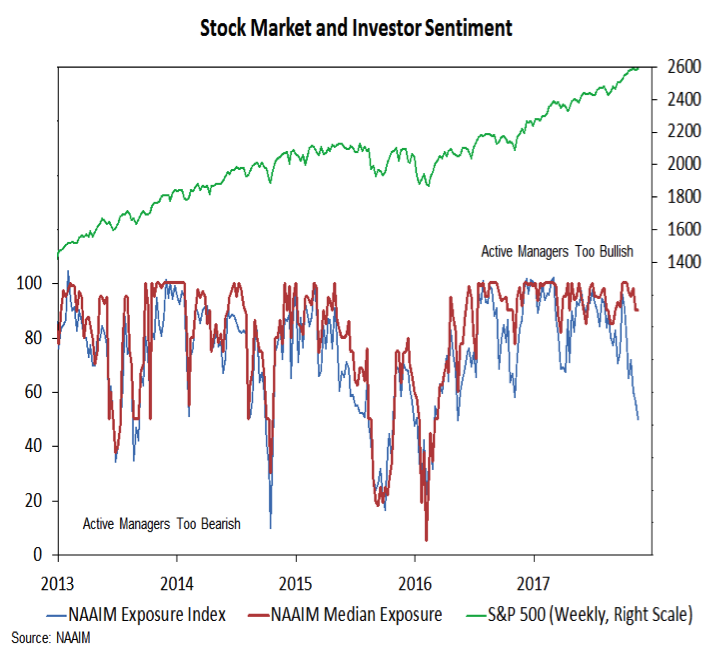
Before getting to the NDR Sentiment Composite, let’s consider the NAAIM data. The NAAIM Exposure index fell again and is now at its lowest level since early 2016. While the Exposure index has moved from 96% in the final week of September to a sub-50% reading this week, the median exposure has hardly been reduced, falling only from 100% to 90%.
The decline in the exposure index has been driven by a re-establishment in the bearish camp rather than bulls reining in their horns. While encouraged by seeing more skepticism, a drop in the median exposure level would give us more confidence that optimism has indeed been unwound.
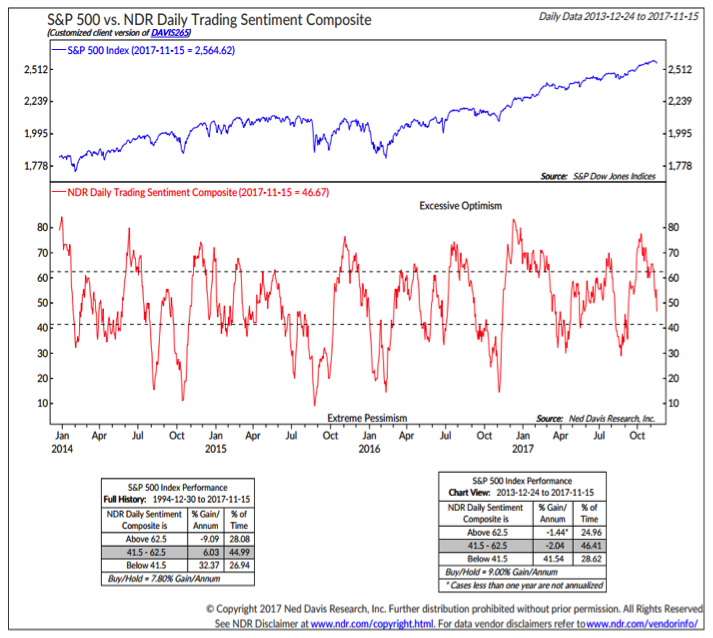
The NDR Trading sentiment composite has been moving lower over the past month. So far, however, it does not show excessive pessimism and over the past four years, all of the net gains in the S&P 500 have come when this indicator has been in the excessive pessimism zone. In other words, while the sentiment backdrop is more mixed and moving toward a more constructive message, it is not there yet.
S&P Consumer Discretionary Sector
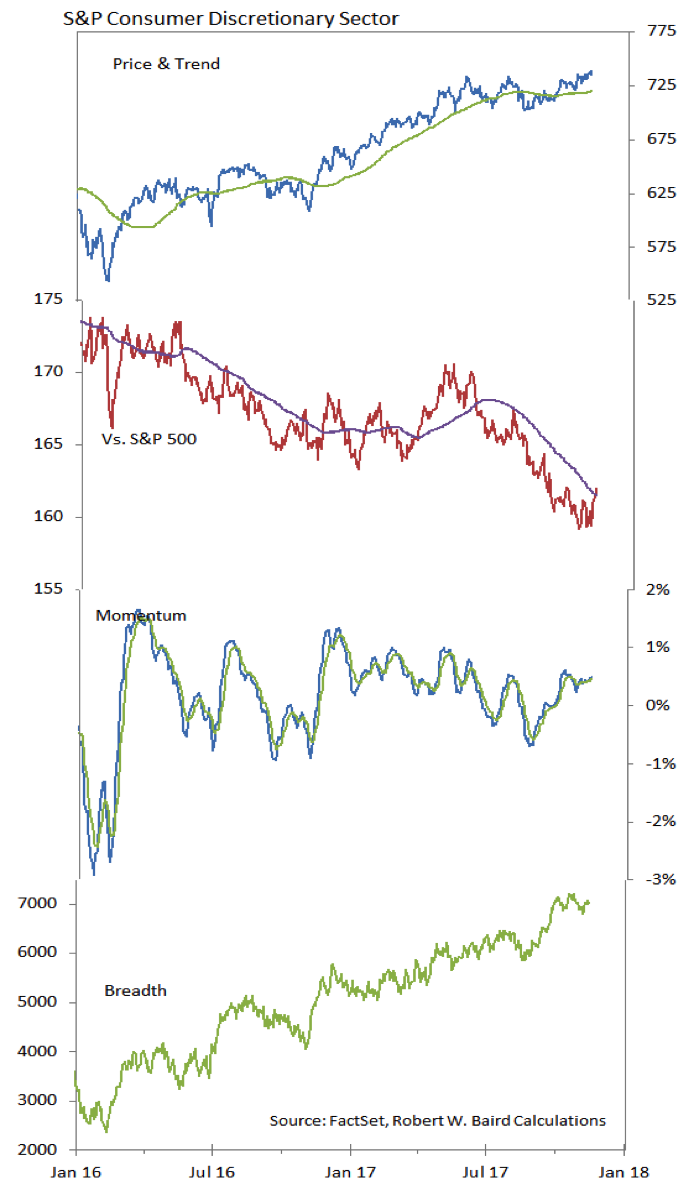
The Consumer Discretionary sector has moved to a new 52-week high today, making it the second sector (after Utilities) to make a new high. A look at the support indicators, however, paints a less constructive picture. On a relative price basis, the Consumer Discretionary sector has bounced, but it is too early to conclude that the longer-term trend there has shifted. Moreover, momentum continues to moderate and breadth has not confirmed the price highs. Consumer Discretionary continues to be ranked in the bottom half of our sector-level relative strength rankings, although it is seeing some improvement there.
Thanks for reading.
Twitter: @WillieDelwiche
Any opinions expressed herein are solely those of the author, and do not in any way represent the views or opinions of any other person or entity.

: Cup (and Maybe Handle) Watch")
 Reaches Important Price Support")

