In this week’s investing research outlook, we examine current trends for the S&P 500 Index (INDEXSP:.INX), while checking in on stock market breadth and investor sentiment indicators. We’ll also discuss current investing themes and news that we are watching in the financial markets.
Here’s our summary of our findings for the week ending November 17, 2017:
Breadth Deteriorating but Not Breaking Down – Minor market breadth divergences that remain minor can represent opportunities. The risk is that minor divergences can morph into more significant divergences. All major divergences start small, but not all small divergences become significant. Right now, the decline in the percentage of stocks trading above their various averages constitutes a minor divergence that could easily be resolved without more significant index-level weakness.
New Leg Higher Should Come with Expansion in New High List – For market breadth to deteriorate at a time when the indexes have cooled off is not uncommon. The test will be if/when the stock market indexes resume their up-trend. If that move is not accompanied by an expansion in the new high list and an increasing percentage of stocks in up-trends, the path for stocks could get rockier.
Sentiment Backdrop Becoming More Mixed – There is still little evidence of any widespread pessimism, but there are signs that optimism has become less excessive. Representative of this shift in sentiment might be the recent readings from the NAAIM data – the Exposure index has dropped from 96% to 49% since the end of September, but median exposure has dropped only to 90% from 100%.
Stock Market Indicators:
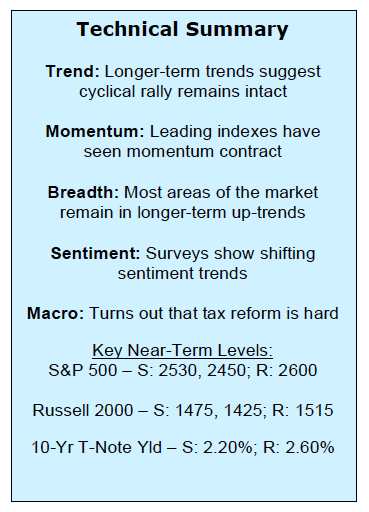
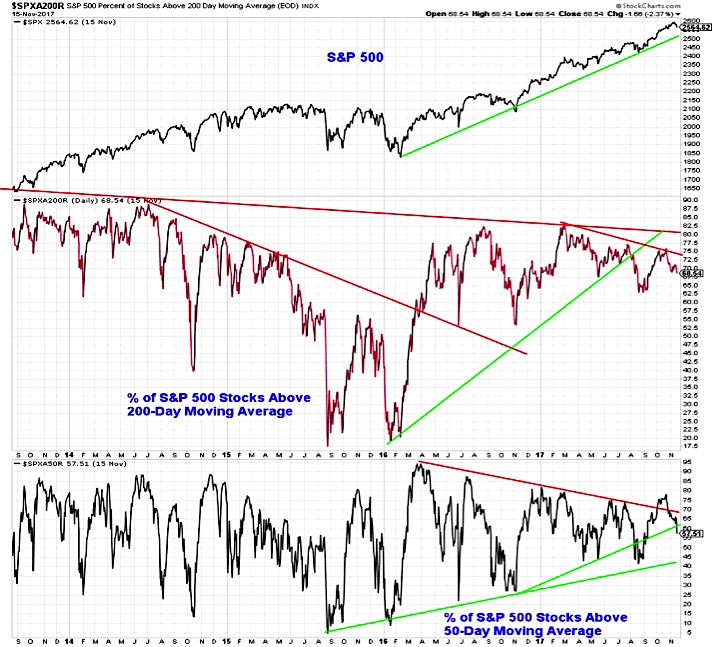
S&P 500 Index
The S&P 500 made a new all-time high in early November, but finished the first half of the month in the red. The percentage of stocks trading above their 50-day or 200-day averages has moved steadily lower since mid-October, and those peaks were hardly robust. At the mid-November mark only 68% of S&P 500 stocks were trading above their 200-day averages (down from 75% in mid-October and 82% earlier this year. Only 58% of stocks were above their 50-day averages, down from more than 75% in mid-October. On the NASDAQ, only 42% of stocks were above their 50-day averages. Issue-level trend deterioration as the indexes consolidate gains is not surprising. Longer-term breadth trends remain strong for now, and there is little evidence that a meaningful break down has occurred.
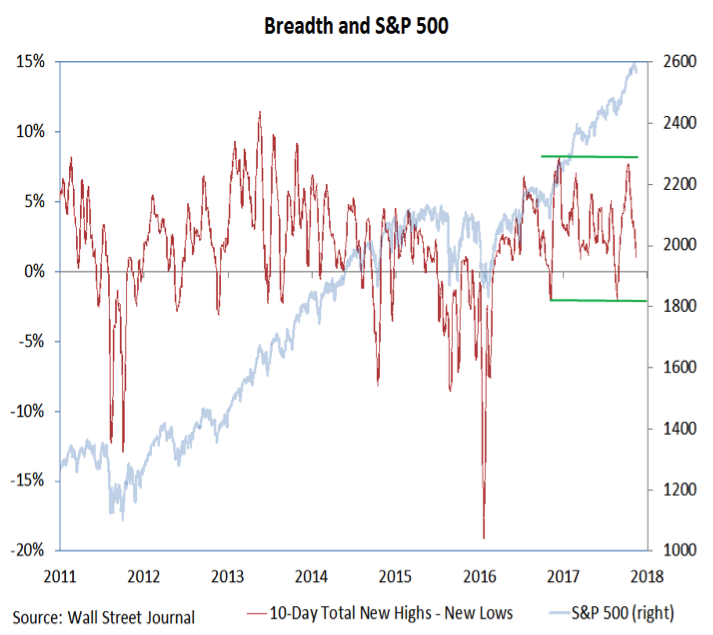
Market Breadth
The best test of broad market strength may come if/when the indexes complete their consolidation and attempt their next leg higher (the longer-term up-trends continue to get the benefit of the doubt). If there is not a meaningful expansion in the percentage of stocks trading above their various moving averages and an uptick in the number of stocks making new highs versus new lows, the sustainability of any index-level rally that does emerge could be called into question.
Investor Sentiment – Multiple Views
With the various sentiment surveys sending increasing mixed signals, it might make sense to review each in turn.
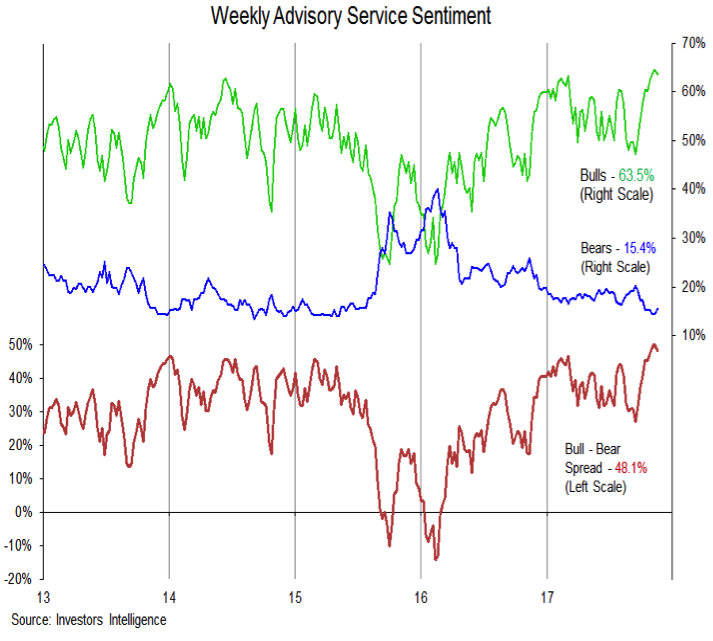
The Investors Intelligence survey of advisory service sentiment showed a slight down-tick in bulls and up-tick in bears this week. The bull-bear spread retreated from 50% to 48.1%. Still, this survey shows widespread and excessive optimism to a degree not seen in 30 years. Stocks have typically struggled to sustain upside progress when bulls have outnumbered bears by such a degree.
continue reading on the next page…

: Cup (and Maybe Handle) Watch")
 Reaches Important Price Support")

