In this week’s investing research outlook, we will analyze the current trends of the S&P 500 Index (INDEXSP:.INX) and Nasdaq Composite (INDEXNASDAQ:.IXIC), check in on market breadth and investor sentiment indicators, and discuss current themes and news that we are watching in the financial markets.
Here’s a summary of our findings for the week ending November 3, 2017:
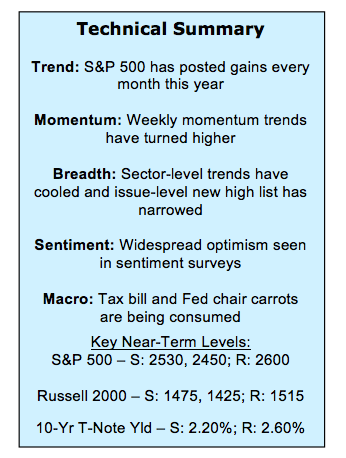
Trends Are Strong, but Stocks Looking for Leadership – The S&P 500 has been resilient, rallying every month this year and posting new weekly closing highs in seven consecutive weeks. This has helped index momentum turn higher. Missing has been relative leadership from the broker/dealer index (which typically acts as a leading index).
Rally Participation Has Narrowed – Gains at the index level can be increasingly attributed to just a handful of stocks. For example, while the NASDAQ composite surged higher in October (producing record closes of its own) the number of stocks making new highs moved lower over the course of the month and by the end of the month only slightly more than half of the stocks on the exchange were trading above their 50-day averages. See page 2 for market breadth charts.
Investors Brimming With Optimism – The Investors Intelligence data shows that among advisory services there was no let-up in optimism this week. Bulls remained at their highest level since 1987 and Bears continued to retreat. Even individual investors are perking up, with the AAII survey showing the most bulls since the first week of 2017. Optimism is elevated as active investment managers have begun to pare their exposure to equities. See page 2 for investor sentiment charts.
Stock Market Indicators
S&P 500 Index
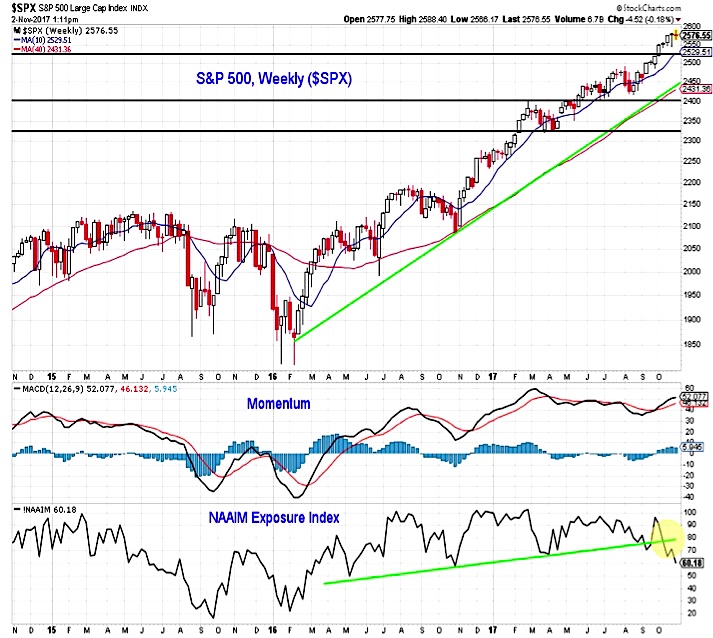
The S&P 500 managed to post its seven consecutive weekly close higher (and in record territory) last week, and with momentum turning higher on a weekly basis, there is little from a trend perspective to suggest that the path of least resistance is anything but higher. One concern on this weekly chart for the S&P 500 is that the trend higher in the NAAIM exposure index has been decisively broken. Median exposure among active investment managers has not yet followed the exposure index lower. If it does (which is typically the case), stocks could see a continued up-tick in volatility.
Broker-Dealer Index
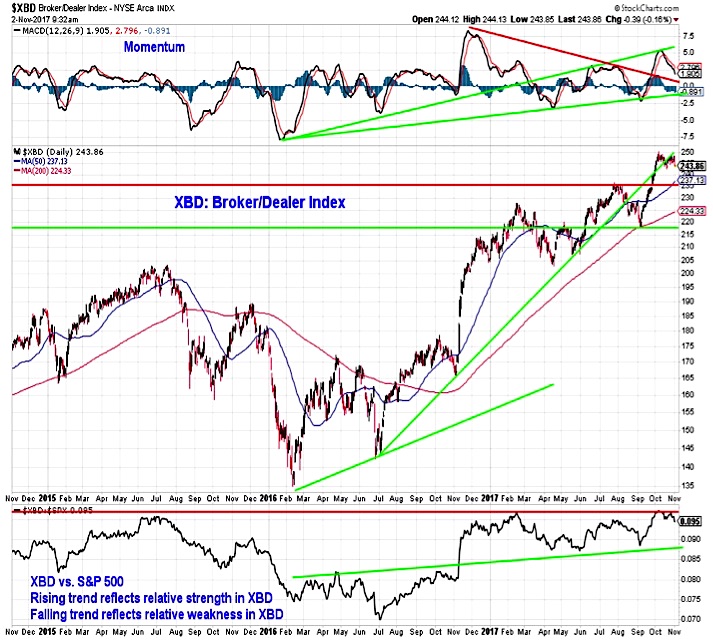
Missing from the rally has been clear relative leadership from the Broker/Dealer index (XBD). The XBD has tested relative price resistance (the bottom panel in the chart to the left) several times in 2017, but has been unable to decisively break out. Leadership from the XBD could fuel a meaningful move higher for the S&P 500, while if the price and momentum weakness that emerged over the course of October carries forward, the S&P 500 could struggle to rally into year end.
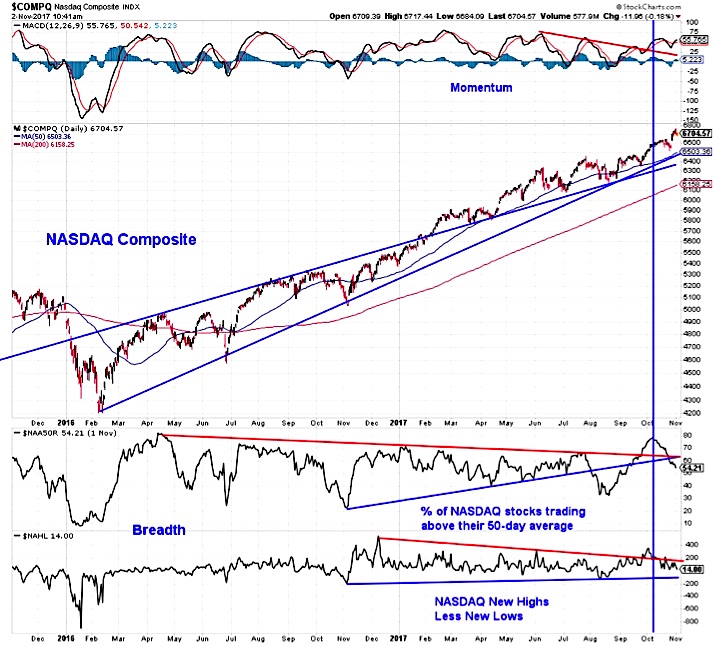
Nasdaq Composite
The NASDAQ Composite posted an impressive gain in October, rallying better than 3.5% in the month. The bulk of those gains, however, were attributable to just a handful of stocks and rally participation narrowed over the course of the month. The number of stocks making new highs declined as the month progressed and the percentage of stocks trading above their 50-day average finished the month at 54% (after peaking near 80% earlier in October). This appears to be a case of the troops not following the lead of the generals.
continue reading on the next page…


 Pressuring Lower Price Support")


 Pressuring Lower Price Support")