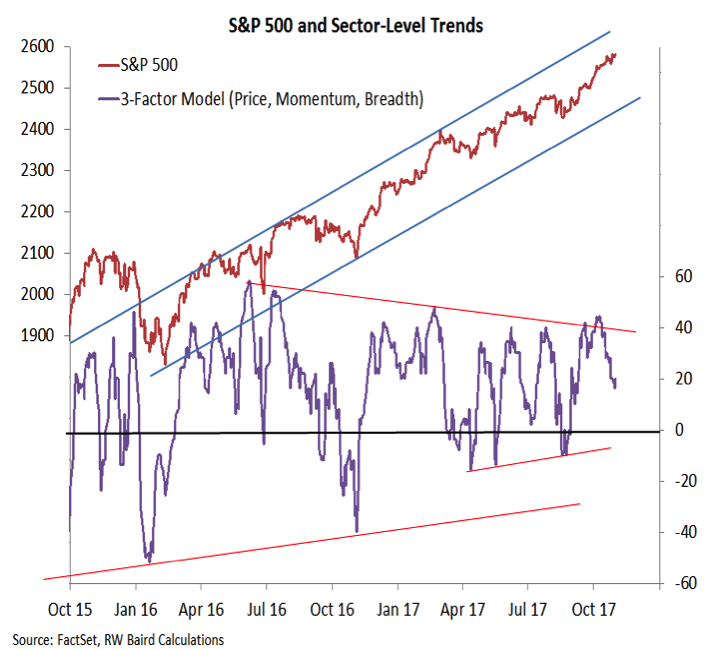
S&P 500 Sector Trends
The October gains in the popular averages hide deteriorating trends that have occurred at the sector level. Our indicator that shows sector-level trends (on price, momentum and breadth basis) has turned sharply lower in recent weeks. While this may be a pause that refreshes as new leadership emerges, it may also speak to an index-level rally that is over-extended and lacking support. Time will tell which of these two scenarios plays out, but it will be hard for the divergence between the sector-level trend indicator and the S&P 500 to persist indefinitely.
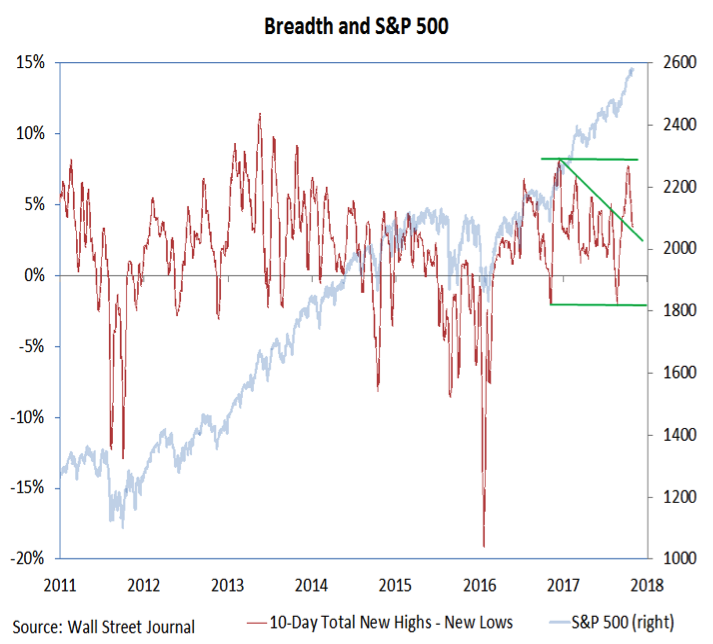
S&P 500 Market Breadth
We have also witnessed a reversal in the number of stocks making new highs. While the S&P 500 (and the NASDAQ) moved further into record territory as October progressed, the number of individual issues joining the index in making new highs contracted.
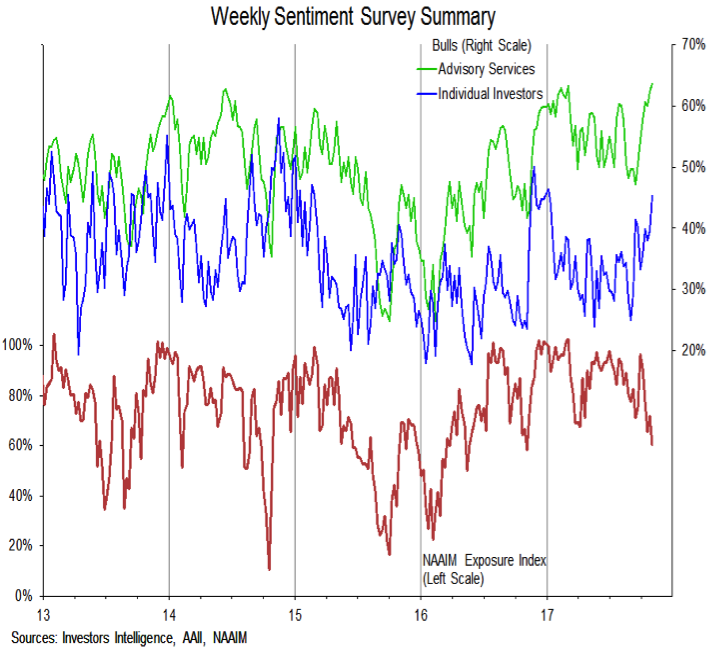
Investor Sentiment
Bulls on the advisory services survey (produced by Investors Intelligence) remain at their highest level in 30 years this week. Individual investors (as measured by the AAII) were their most bullish since the first week of 2017. This reported optimism comes as the NAAIM exposure index (as was mentioned before) continues to leak lower. Elevated investor optimism at a time when exposure to equities is beginning to be reduced poses a risk for stocks as we move toward year end. Coupled with the deterioration being seen beneath the surface, stocks could be poised for a rocky fourth quarter even if the path is ultimately higher.
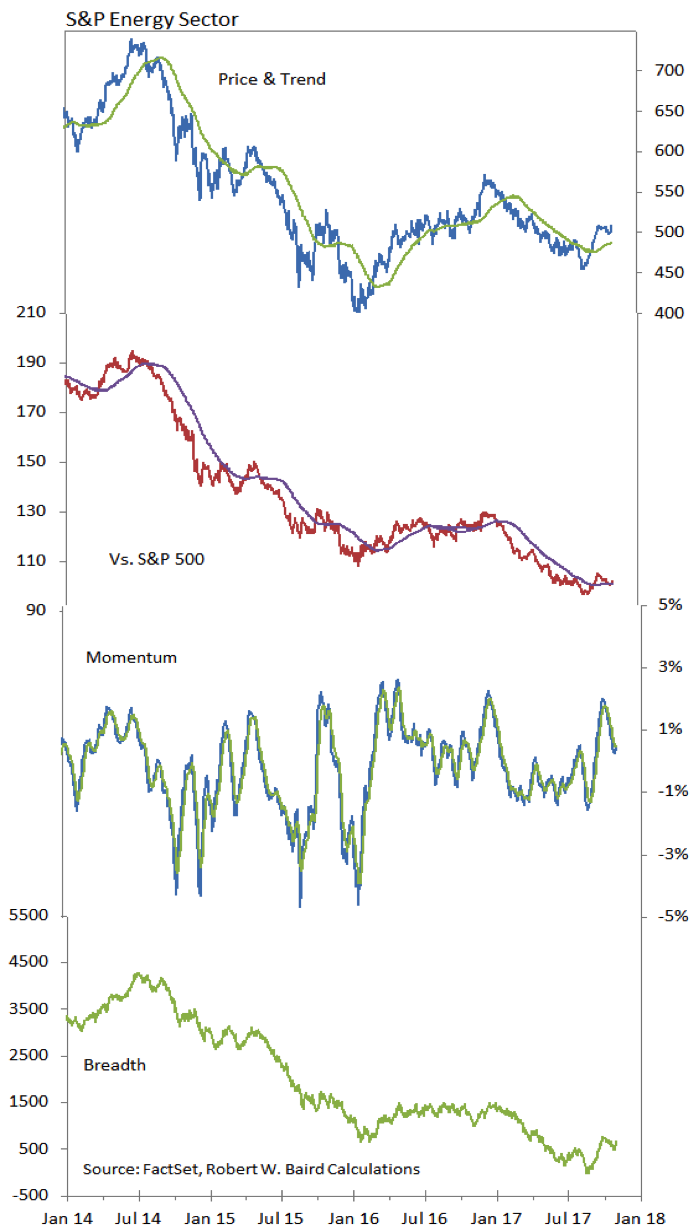
S&P Energy Sector
The Energy sector has been the second worst performing sector of the S&P 500 in 2017, faring better only than the Telecom Services sector and lagging the S&P 500 by 2300 basis points. More recently, however, the Energy sector has shown some life. Both price and breadth have rallied off of their Q3 lows and the relative price line has actually climbed above its moving average. Sub-industry relative price trends have some Energy related groups on the rise as well. It is too early to conclude that the longer-term trends have turned, but the near-term improvement that has been seen is encouraging.
Thanks for reading.
Twitter: @WillieDelwiche
Any opinions expressed herein are solely those of the author, and do not in any way represent the views or opinions of any other person or entity.


