S&P 500 Weekly Outlook & Technical Market Review – September 3
Here’s a look at some key stock market indicators and emerging themes that we are watching in our latest “Stock Market Outlook”:
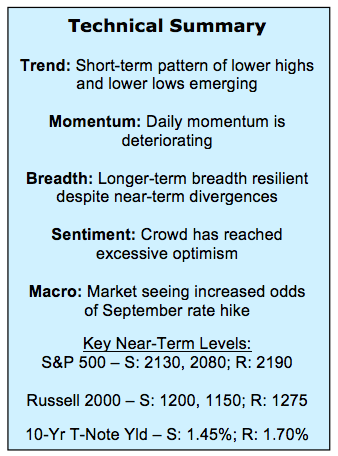
Tightening Polls May Weigh On Stocks – The short-term trend in the S&P 500 Index (INDEXSP:.INX) is showing some vulnerability at a time when the near-term path forward for stocks could be tied to presidential election uncertainty. Stocks typically struggle ahead of elections when the incumbent part loses, so Trump’s recent bounce in the polls may be a headwind for stocks. The good news is that stocks typically rally post-election regardless of how the incumbent party fares.
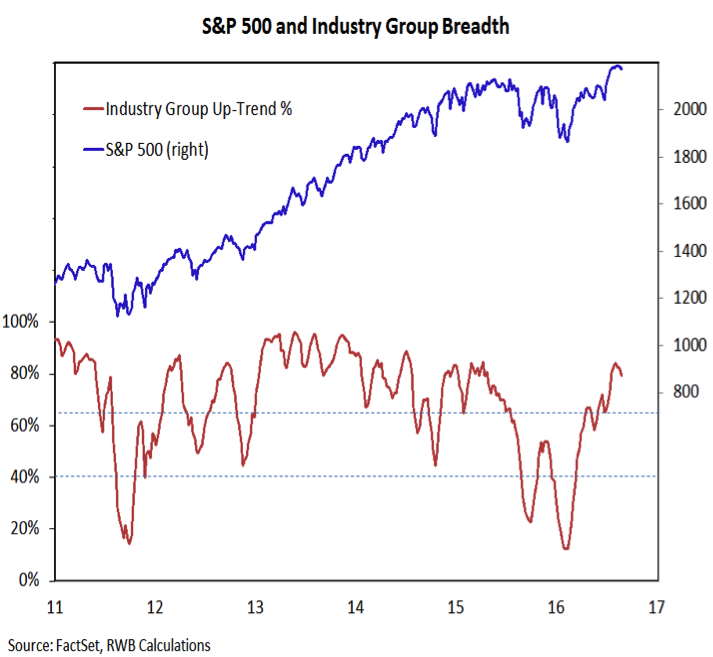
Long-Term Breadth Trends Remain Bullish – While some near-term market breadth divergences have been observed, the longer-term trends remain robust and show a night-and-day difference between this year and last. While the risk of a pullback is elevated as we move toward the election, we would expect any correction to be limited in degree and duration (although that does not mean the experience of it will be pleasant).
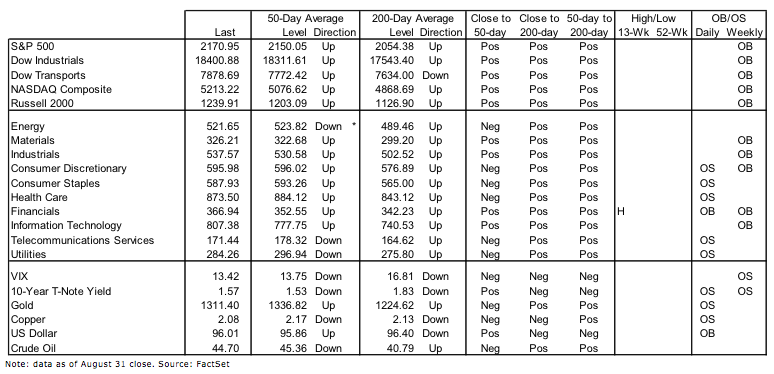
Rise in Bond Yields Positive For Broker/Dealers, Headwind For Gold – Bond yields have rallied off of their lows and this has helped the Financials sector get back in gear. It has also proven to be a headwind for Gold. This precious metal has pulled back toward important support (see chart & analysis further below).
Stock Market Indicators – S&P 500 Weekly Outlook (click to enlarge)
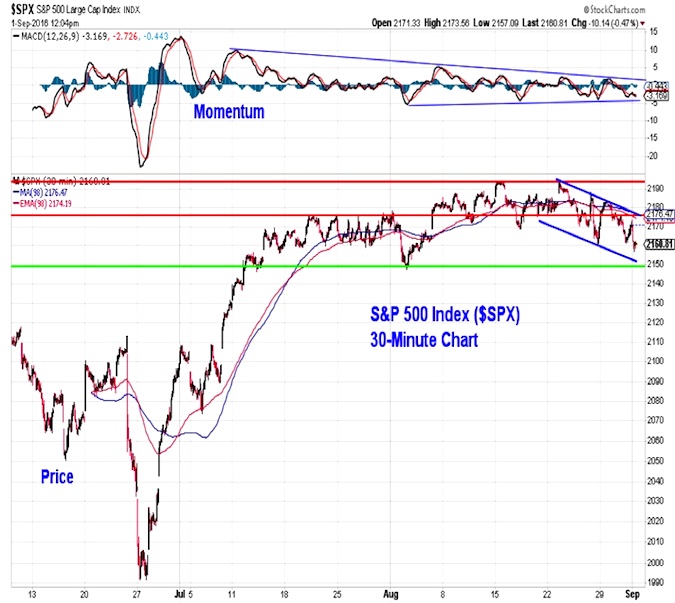
S&P 500 Index – Technical Analysis
The S&P 500 remains largely range-bound (between 2150 and 2190) and realized volatility on the index has fallen toward all-time lows. On a short-term basis, however, a pattern of lower highs and lower lows is emerging on the price chart and there is a pattern of lower highs on the momentum chart stretching back to the late-June surge in momentum. In other words, near-term momentum remains a headwind and the price chart appears to be rolling over. On this chart, 2150 appears to be important price support. Additional price support lies near 2110.
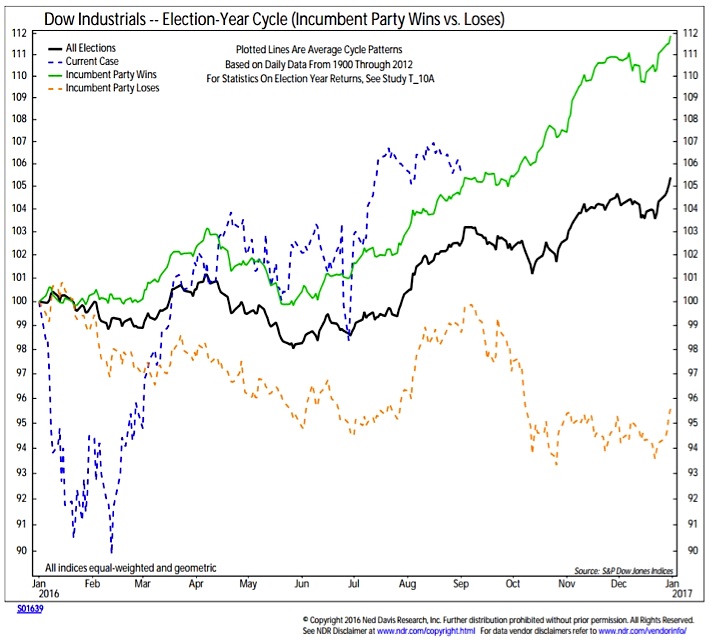
Dow Jones Industrials – Presidential Election Seasonality
The overall seasonal pattern in Presidential election suggests limited downside/upside between now and election day. However, this masks a sharp divergence in experience depending on whether the incumbent party wins or loses. When the incumbent party goes on to win, there is usually only minimal weakness ahead of the presidential election. And this is often followed by a powerful rally to close out the year. In years when the incumbent party loses, stocks still rally into year-end, but the period prior to the election is marked by more pronounced weakness. If Donald Trump continues to rise in the polls, history would suggest more volatility for stocks over the near-term.
Sector Trends
We talked last week about the rally losing a step and focused on some near-term market breadth divergences in sector-level trends and number of stocks making new highs. Those have not been resolved, but it is important to keep in context the longer-tem breadth trends, which remain bullish.
The sharp expansion in rally participation seen over the past few months is a significant reason to believe that even if stocks struggle into the November election weakness could be limited in degree and duration. In this context, the post-Brexit low on the S&P 500 (near 2000) may represent an important support longer-term support level.
continue reading on the next page…

: Showing Some Signs of Emerging Strength")
