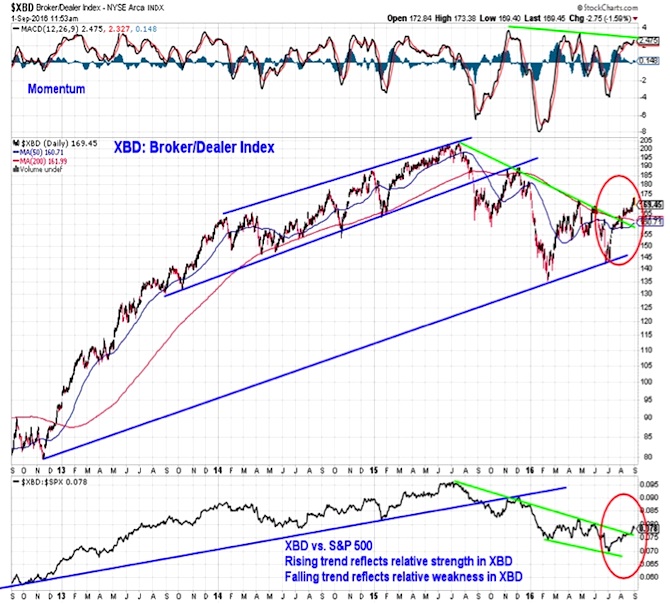
Recent strength in the Broker-Dealer index adds to the more constructive longer-term view. On an absolute price basis, the XBD broke through the down-trend off of the mid-2015 highs at the beginning of August.
The relative price down-trend has also now been broken and the momentum down-trend is being challenged. Leadership from the Broker/Dealer group is usually considered bullish for the market overall.
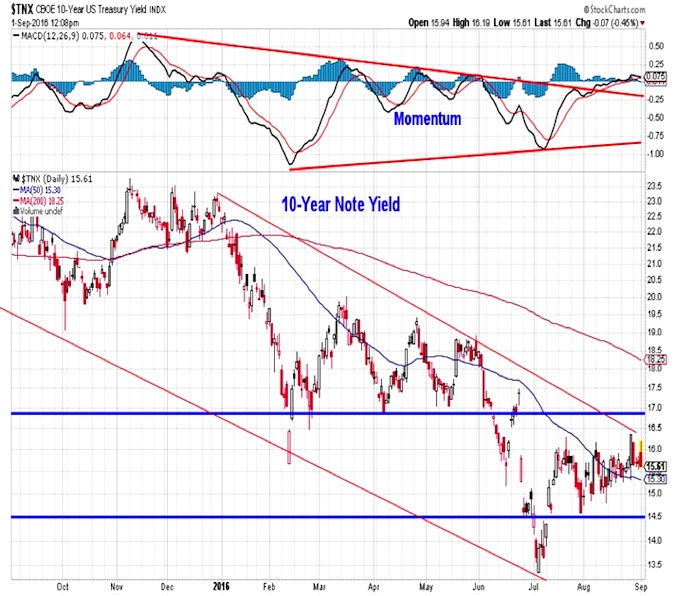
10 Year Treasury Note Yield
For many, sustained leadership from the Financials sector (and its various industry groups) is dependent on bond yields moving off of their recent lows. While the Broker/Dealer index has seen more pronounced strength than have bond yields, directionally, the recent moves have been the same. The 10-year T-Note yield is challenging its down-trend line while momentum continues to drift. While getting above 1.60% (even temporarily) has been viewed as significant, a sustained move above 1.70% may represent a more meaningful change in trend. For context, the yield at the beginning of the year was near 2.25%.
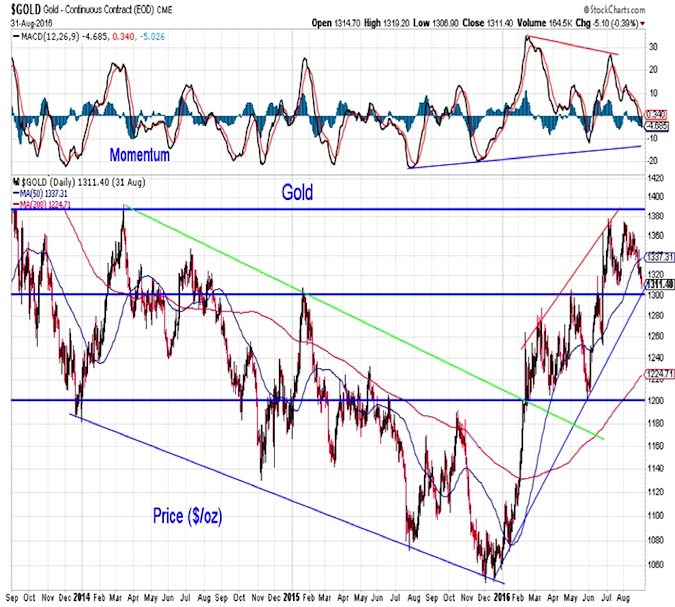
Gold Prices Decline
A significant long-term driver of gold prices is real bond yields. It is not then surprising to see that as yields were falling over the first half of 2016, gold rallied strongly. Nor is it surprising that as yield has moved off of their July lows, gold has stumbled. From a technical perspective, the $1300/oz level now looms as important support following the failure at resistance near $1380. A failure at this level could lead to a test of support near $1200/oz.
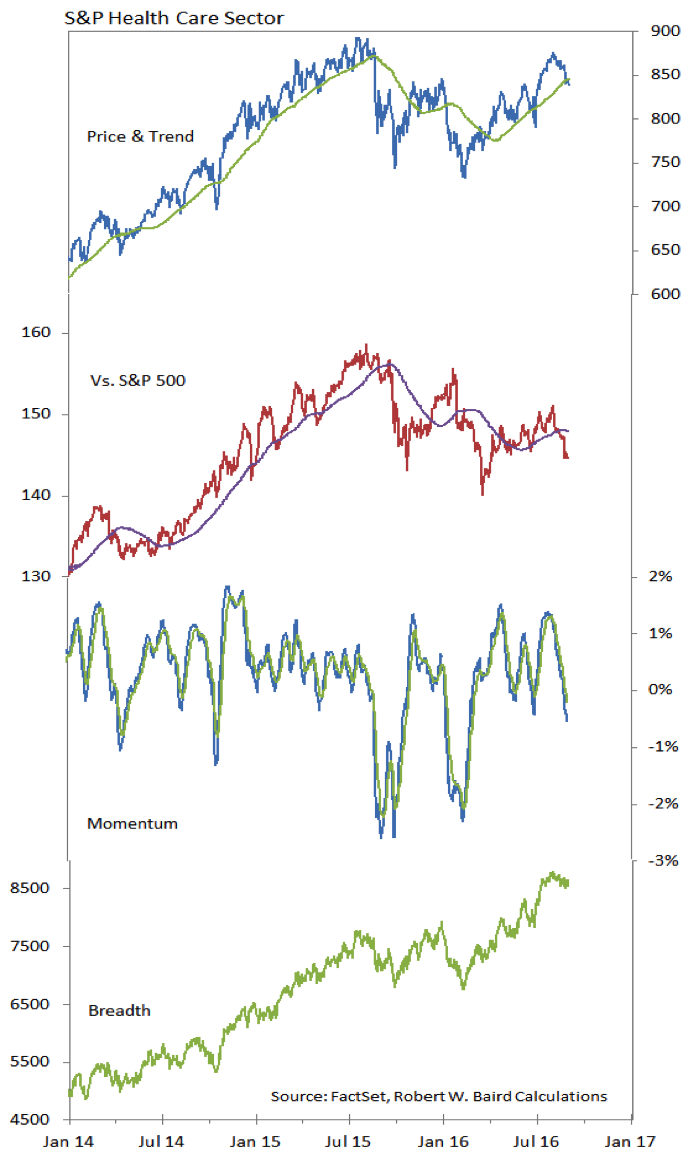
Health Care Sector
Breadth trends in the Health Care sector remain strong, and price is testing as support what had been strong resistance. The relative price line, however, continues to trend lower, and has yet to make either a meaningful higher low or higher high. Momentum has also weakened of late and this could mean that price will have trouble holding support.
Thanks for reading.
Twitter: @WillieDelwiche
Any opinions expressed herein are solely those of the author, and do not in any way represent the views or opinions of any other person or entity.


