In this week’s investing research outlook, we analyze the technical setup and trends of the S&P 500 Index (INDEXSP:.INX), key stock market trends and indicators, and discuss emerging themes and news that we are watching closely in our investing research.
Here’s a summary of our findings for the week ending July 28, 2017:
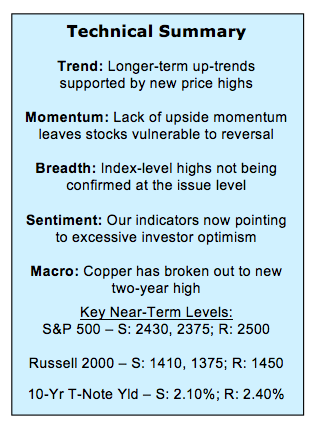
Stocks Lacking Momentum – While July has brought a host of new highs across various indexes, these have largely come with a conspicuous absence of momentum. While new price highs are encouraging in and of themselves, the lack of momentum (particularly in light of surging optimism and potential seasonal headwinds) could end up weighing on stocks.
Seasonal Patterns Could Become More Challenging – Stocks enjoyed a seasonal tailwind coming into 2017 but that pattern is becoming more challenging as we move into the second half of the year. Looking at just the four-year cycle, the pattern remains generally higher into 2018. When the one-year and 10-year cycles are added to create a cycle composite, stocks could be vulnerable as we work toward the fourth quarter.
Optimism and Complacency Widespread – Our sentiment indicators have seen a shift toward excessive optimism in recent weeks and we now rate investor sentiment as a near-term headwind for stocks. Survey data shows investor bullishness has increased and options data shows a collapse in the demand for puts – a sign of little fear and widespread complacency. Overall this suggests risks for stocks have increased.
Stock Market Indicators
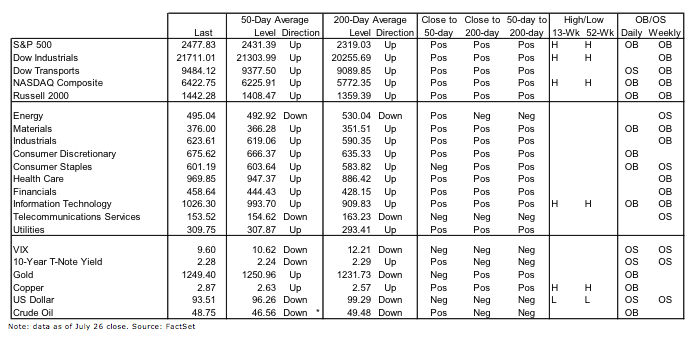
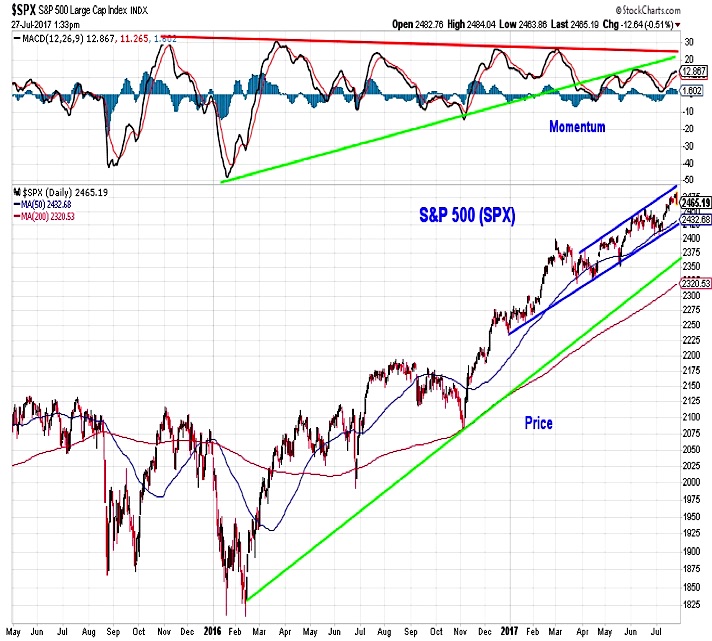
S&P 500 Index
The S&P 500 has made new price highs, but momentum has continued to struggle. The lack of upside momentum could leave the index vulnerable to a reversal of the recent price strength. A pullback toward the trend line off of the 2016 lows could provide the index with the first 5% correction in over a year. Shorter-term support comes in near 2430, coinciding with the trend line that has emerged off of the 2017 lows.
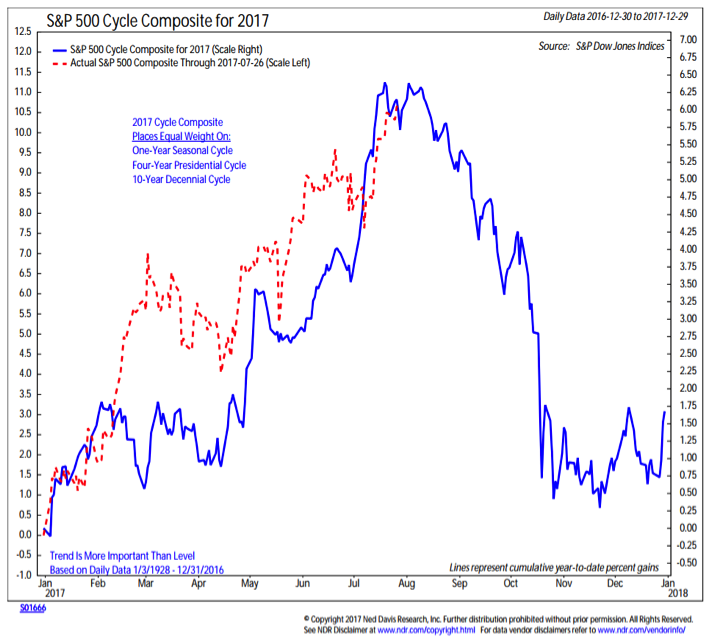
S&P 500 Cycle Composite
The cycle composite for 2017 (which blends seasonal charts on a 1-year, 4-year and 10-year basis) provided a useful roadmap for stocks for the first half of the year. If this relationship holds, the second half of the year (particularly heading into October) could be rockier and oft-noted absence of volatility could become a bit of nostalgia. Balancing this perspective is the four-year pattern which suggests stocks could work higher into 2018, and the tendency for un-volatile first halves to be followed by stronger-than-average second halves.
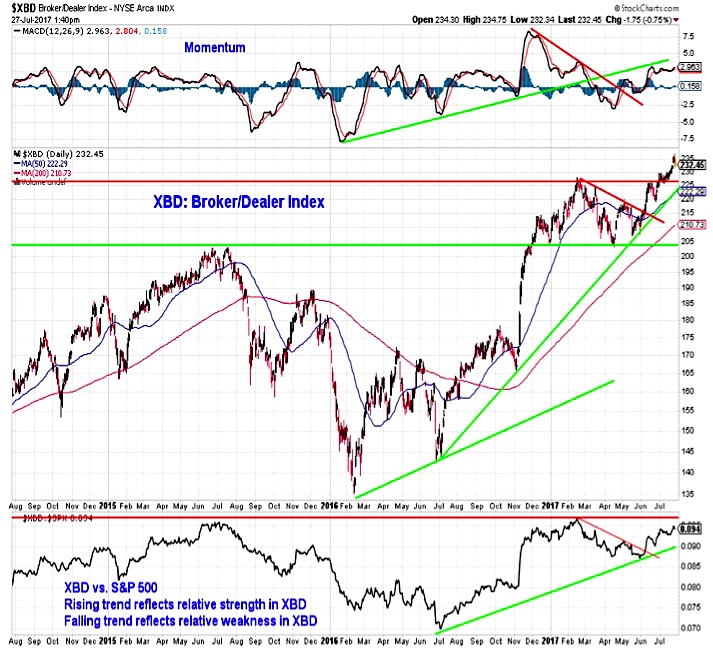
Broker Dealer Index (XBD)
A similar story is told by the Broker/Dealer index. New price highs without a meaningful uptick in momentum. At this point this index is participating in the rally in the broader market, but not really providing. A new relative price high (for XBD versus the S&P 500) would confirm leadership from the index and be a bullish development for stocks overall.
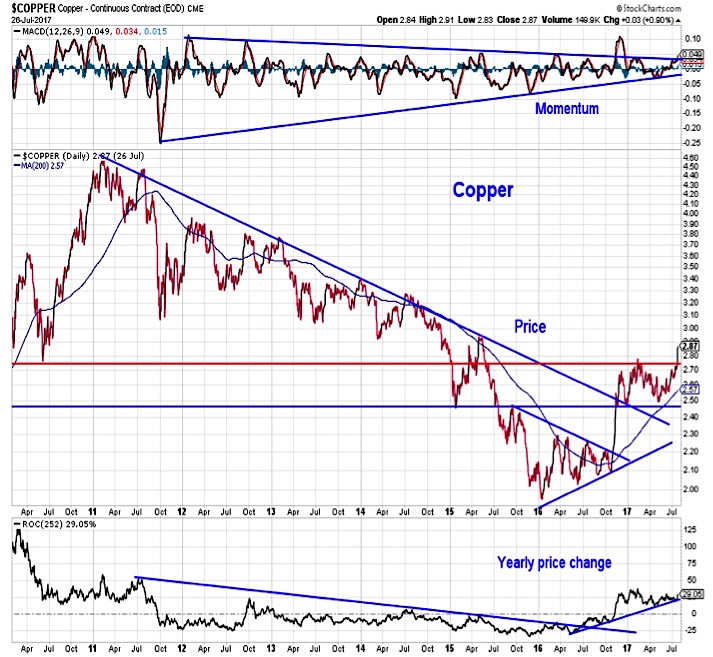
Copper Prices
While excessive optimism (more on that in a moment) is weighing on the overall weight of the evidence, the upside breakout in copper (out of nine month consolidation and to its highest level in more than two years) is important confirmation that the global economic recovery remains on track and is gaining some upward momentum of its own.
continue reading on the next page…


