 By Andrew Nyquist
After weeks of quick bursts and all-in back and forth moves, the financial markets finally gave us breather. Narrow ranges and lower volatility fed the markets what they needed to consolidate gains and grind higher. This is breathing life into the bullish thesis and has many lined up on both sides of the market aisle barking their cases. To them, I say “one for the money, two for the show.” In other words, it takes two to tango.
But this weekend update is as much an exercise in looking back on the markets as it is looking forward. And make no mistake, the market action over the coming weeks will be important. So stay focused, stick to a plan, and do your best not to marry your convictions.
True, this week was a bit of a snoozefest; but let’s face it, that’s the way a healthy market should be. Unfortunately it’s only one week, so we need more time to see if this is the start of something more constructive. And further, the markets will be up against some near-term technical obstacles and confirmation correlations.
So let’s review. Last week I noted three lingering concerns and one future concern (in quotes & italics).
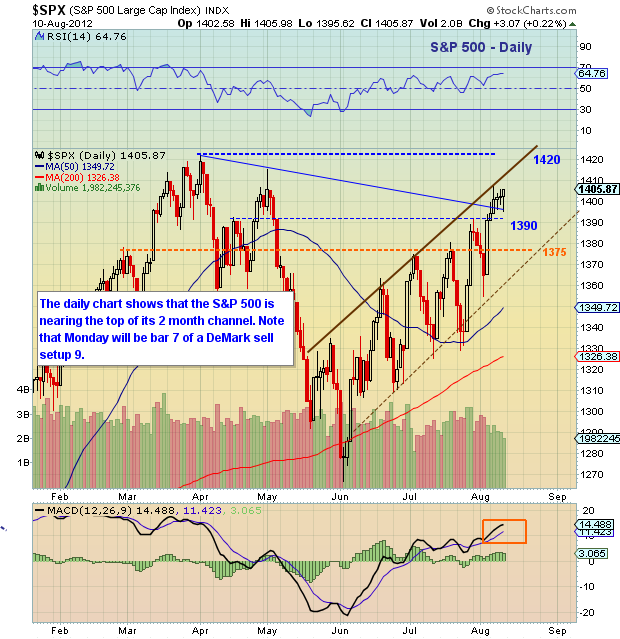
1) “S&P 500 follow through above 1390.” Check. “Over head resistance resides between 1402-1405, then free space to take a run at the Spring highs.” Check. A close above this level indicates the markets desire to retest the highs. In summary resistance above at April highs, support below at 1390, then 1375.
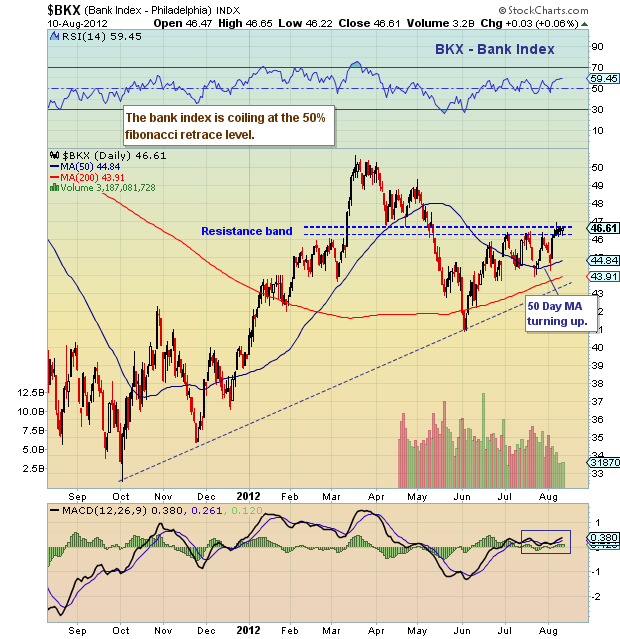
2) “Continued strength with the Banks/Financials. A breakout above 47 on the Bank Index (BKX) and 15 on the Financials Select Sector (XLF) would be a good sign.” We’re right there. As Todd Harrison is apt to say “as go the piggies, so goes the poke.”
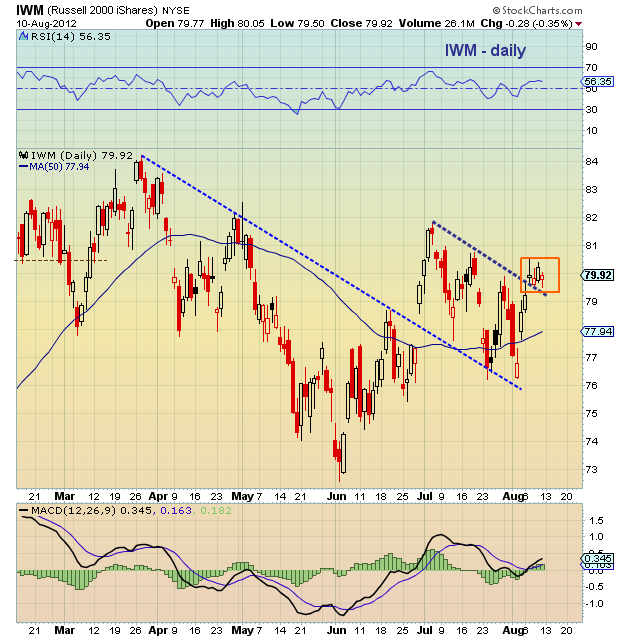
3) “The Russell 2000 iShares (IWM) has been lagging, so a break above the recent downtrend line and continued move through the 80 level is key to the bullish case.” So far so good. The IWM broke through the 80 level (descending downtrend line) and held up pretty well all week. Holding above this breakout level bears significance, as small cap participation is indicative of risk appetite.
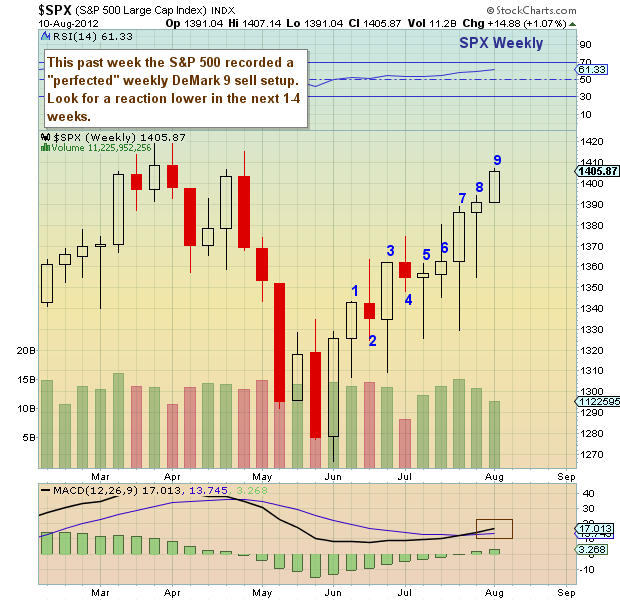
4) “As well, the S&P 500 is on bar 9 of a “perfected” weekly sell setup — see weekly chart below. So even if we head higher next week, we may see some backing and filling (or downside) shortly thereafter.” Indeed the S&P 500 completed a perfected weekly DeMark sell setup indicating that a reaction lower during the next 1-4 weeks is likely. The setup does not mean that a pullback will occur, just that it has a higher likelihood of occurring due to exhaustion. Again, this is just another indicator. Note as well that the daily bar chart is on bar 7 (Monday) of a sell setup, so this may also run to completion this week if the markets head higher early next week.
Personally, I’m keeping trades quick and light until I get a better gauge of how well the markets hold up in the face of old highs (resistance) and the weekly sell setup. No doubt the markets have been strong and I respect that, but I also respect the technicals. And they are telling me to participate with caution.
As traders and investors, we put our money on the line each and every day. We willfully pay the price of admission to be a part of the “show.” Through ups and downs, we bear the burden of our passion. Investing isn’t easy… not even close. It takes a lot of hard work, passion, and experience. Trade safe, trade disciplined. And good luck in the week ahead.
S&P 500 Daily Chart:
S&P 500 Weekly Chart:
The Bank Index (BKX) Daily Chart:
Russell 2000 iShares:
———————————————————
Twitter: @andrewnyquist and @seeitmarket Facebook: See It Market
No position in any of the securities mentioned at the time of publication.
Any opinions expressed herein are solely those of the author, and do not in any way represent the views or opinions of his employer or any other person or entity.


