 By Andrew Nyquist
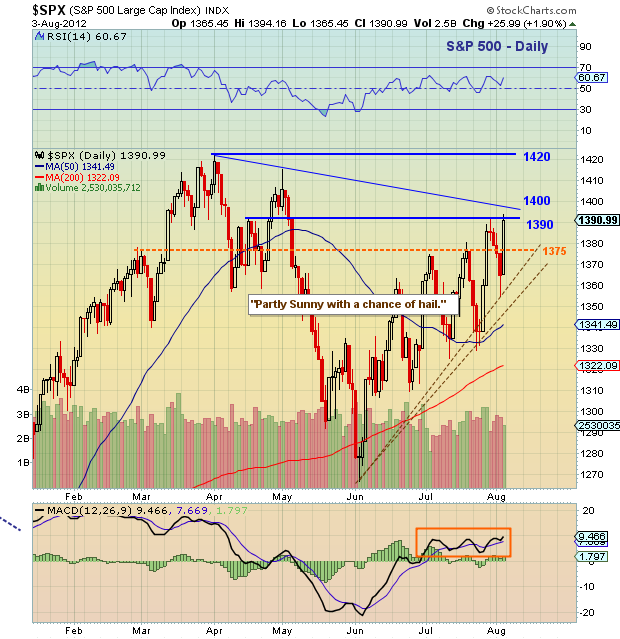
A couple weeks back I dubbed the financial markets, “partly sunny with a chance of hail,” and no doubt this theme has continued forward, allowing no rest for the weary.
For the past two months, investors have been whipped around as if they were on a crazy roller coaster ride, hooting & hollering at each turn. But even that description doesn’t do the market action justice.
So let’s try again: as the roller coaster ride seemingly comes to an end, and just as you attempt to get out of your seat, it takes off again… and repeats this over and over, while Ozzy Osborne’s “Crazy Train” plays in the background.
In all honesty (and seriousness), the action in the financial markets has been an excellent exercise in investor patience and psychology, affording nimble traders with opportunities to buy the dips and sell the rips on select stocks and indices (and with defined risk).
Yet even as the markets have seemingly found their way higher, and appear to be looking up now, I’m still going to bring a tactical approach to the markets next week, looking for good risk/reward setups where I have space to play between the hashes and create sound trading/investing plans.
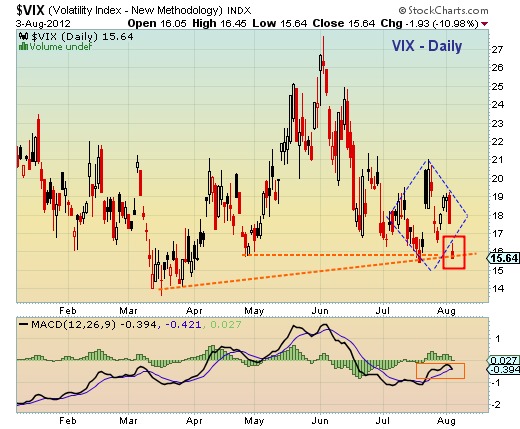
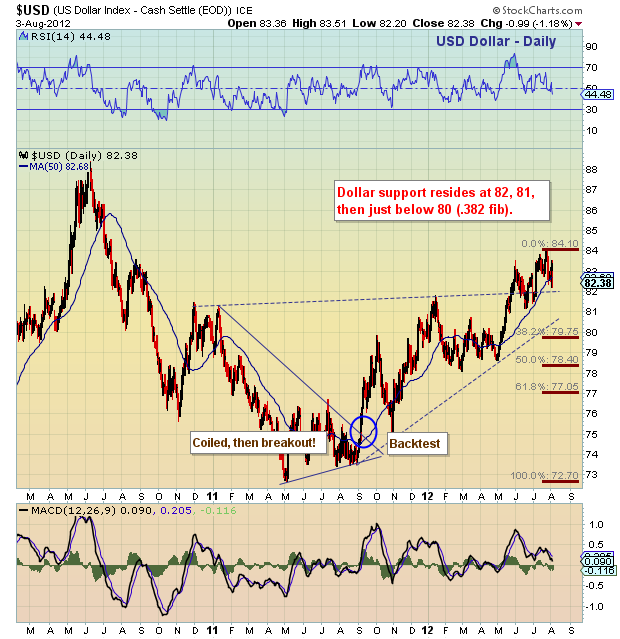
A quick review of the technicals and corollary indices indicates that the markets may be in line for more gains next week. For starters, the dollar has been weak and the banks have been performing better. As well, the Volatility Index (VIX) fell out of bed on Thursday and Friday. Yet, even with these positive signs, I’m inclined to remain somewhat cautious, patiently waiting for additional confirmation on the following three items.
1) S&P 500 follow through above 1390. Over head resistance resides between 1402-1405, then free space to take a run at the Spring highs. Key support below at 1375.
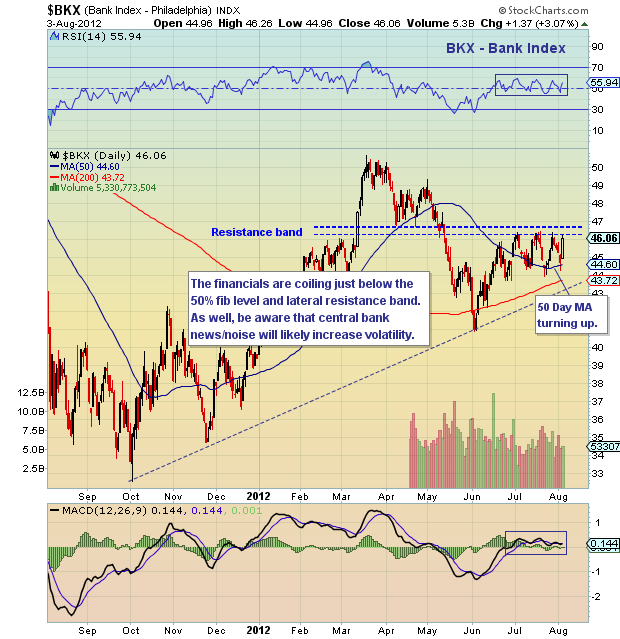
2) Continued strength with the Banks/Financials. A breakout above 47 on the Bank Index (BKX) and 15 on the Financials Select Sector (XLF) would be a good sign.
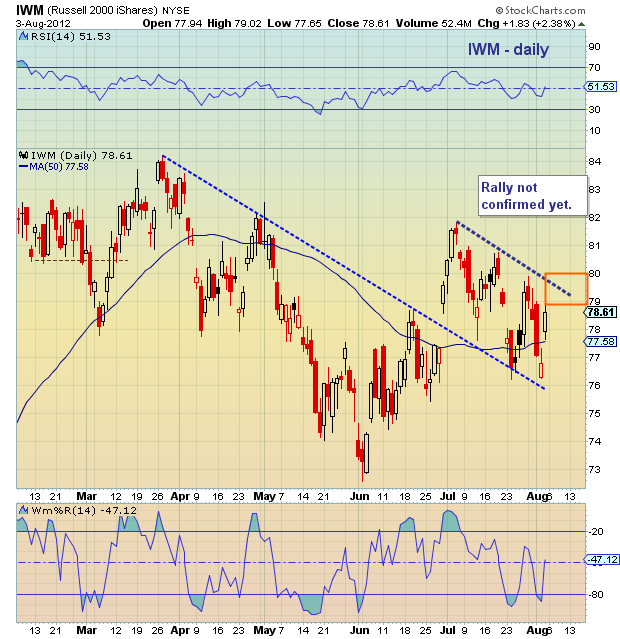
3) The Russell 2000 iShares (IWM) has been lagging, so a break above the recent downtrend line and continued move through the 80 level is key to the bullish case.
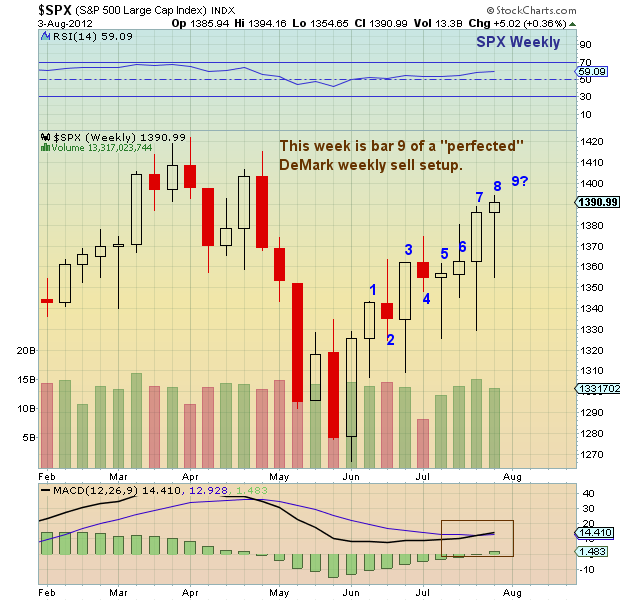
As well, the S&P 500 is on bar 9 of a “perfected” weekly sell setup — see weekly chart below. So even if we head higher next week, we may see some backing and filling (or downside) shortly thereafter.
See technical charts below. Enjoy the week ahead and trade safe.
S&P 500 Daily Chart:
S&P 500 Weekly Chart:
VIX Volatility Index Daily Chart:
BKX Bank Index Daily Chart:
US Dollar Daily Chart:
Russell 2000 iShares (IWM) Daily Chart:
———————————————————
Twitter: @andrewnyquist and @seeitmarket Facebook: See It Market
No position in any of the securities mentioned at the time of publication.
Any opinions expressed herein are solely those of the author, and do not in any way represent the views or opinions of his employer or any other person or entity.

