With global stock markets in free fall because of the growing uncertainty surrounding the coronavirus, we need to step back to the long-term charts to make a judgment of where we can look for support.
Today we look at a “monthly” chart of the S&P 500 Index.
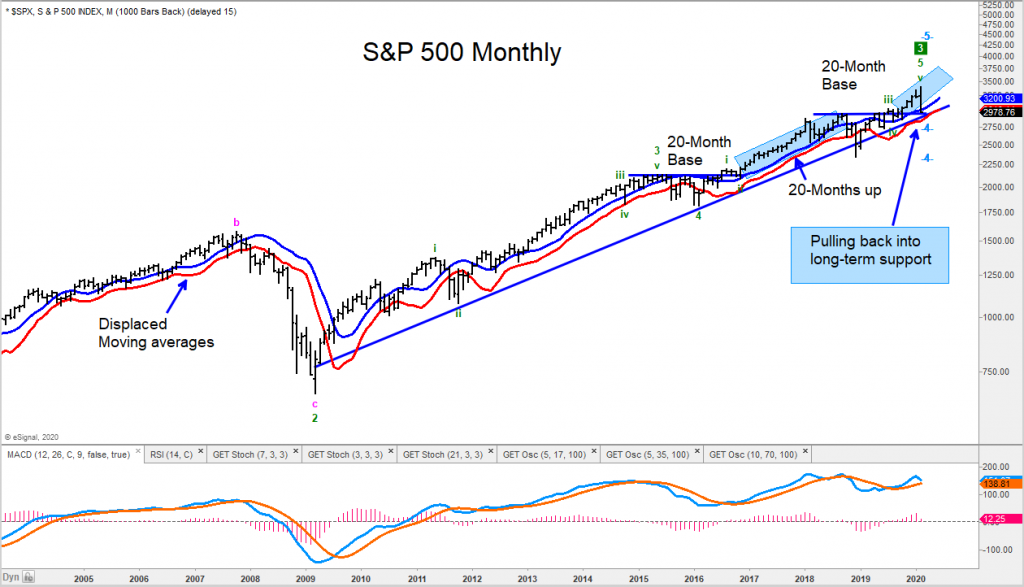
The most recent sharp decline off a high was in early 2018, and as you can see on the chart, the S&P 500 Index held its displaced moving averages (DMA’s).
This correction has pulled back to the top of the 20-month base and thus far is holding those DMA’s.
It doesn’t make sense to us to be selling here, but to make a buy list and slowly put money to work.
Clearly, equities related to travel & leisure will continue to be under pressure, so we would look in other sectors such as technology and healthcare.
I am screening for equities that are holding up well by going down less than the market for potential buys in the coming days and will send out ideas to clients as they present themselves.
The author may hold positions in mentioned securities at the time of publication. Any opinions expressed herein are solely those of the author, and do not in any way represent the views or opinions of any other person or entity.


 – Warren Buffett’s Biggest Holding!")

 May Tip Stock Market’s Next Move")

