With the month of March and Q1 in the books, its time to take another look and update some stats from my recent articles to try to get a sense of what’s happening out there.
Those who have followed me on twitter for some time or know me professionally, will attest to the fact that I am a big believer in what the markets ARE doing as a basis to formulate an opinion of where it MAY go. So for me, market internals matter, volume trends matter and I am a big believer in underlying trends. I was taught that finding out what traders are doing is measurably more important than what they say they are doing although I do believe sentiment indicators at extremes offer some very important clues for traders.
That said, let’s dig in and look at the S&P 500 Index (INDEXSP:.INX) across multiple investing time frames.
In my last update, I mentioned the broad market S&P 500 was butting up against the upper Bollinger band on the monthly chart set to 2 standard deviations from the 13 period exponential MA which for as long as I have been trading, has been the ultimate measure of an overbought market. I also mentioned how we haven’t closed above this measure since March of 2000. We have hugged the line or traded above it intra month several times but invariably pullback to close below it. Last month we traded right up to the level and pulled back to set lows for the month and finally close roughly at the mid point of the trading range for the month.
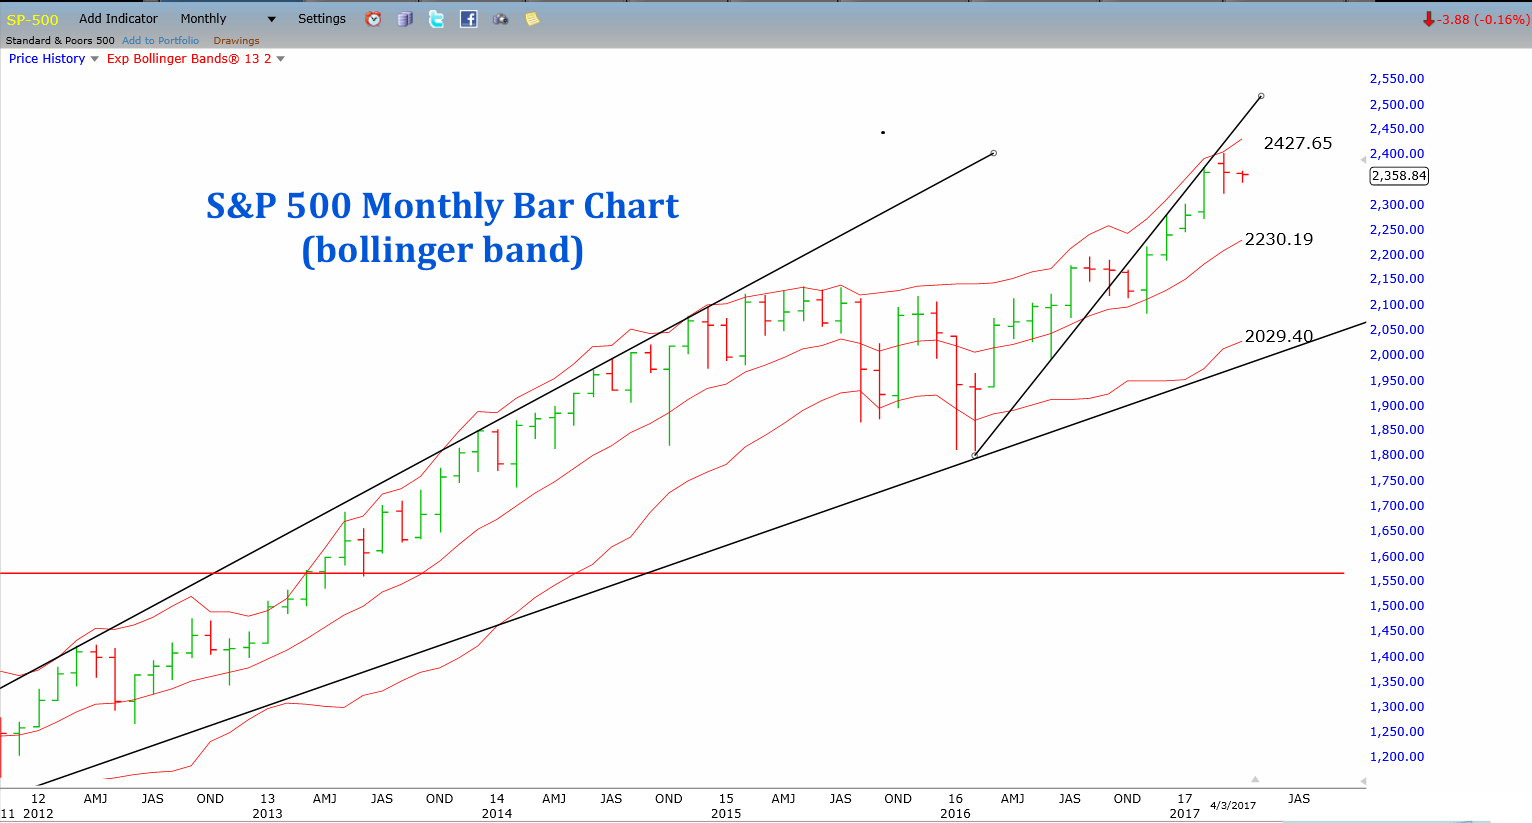
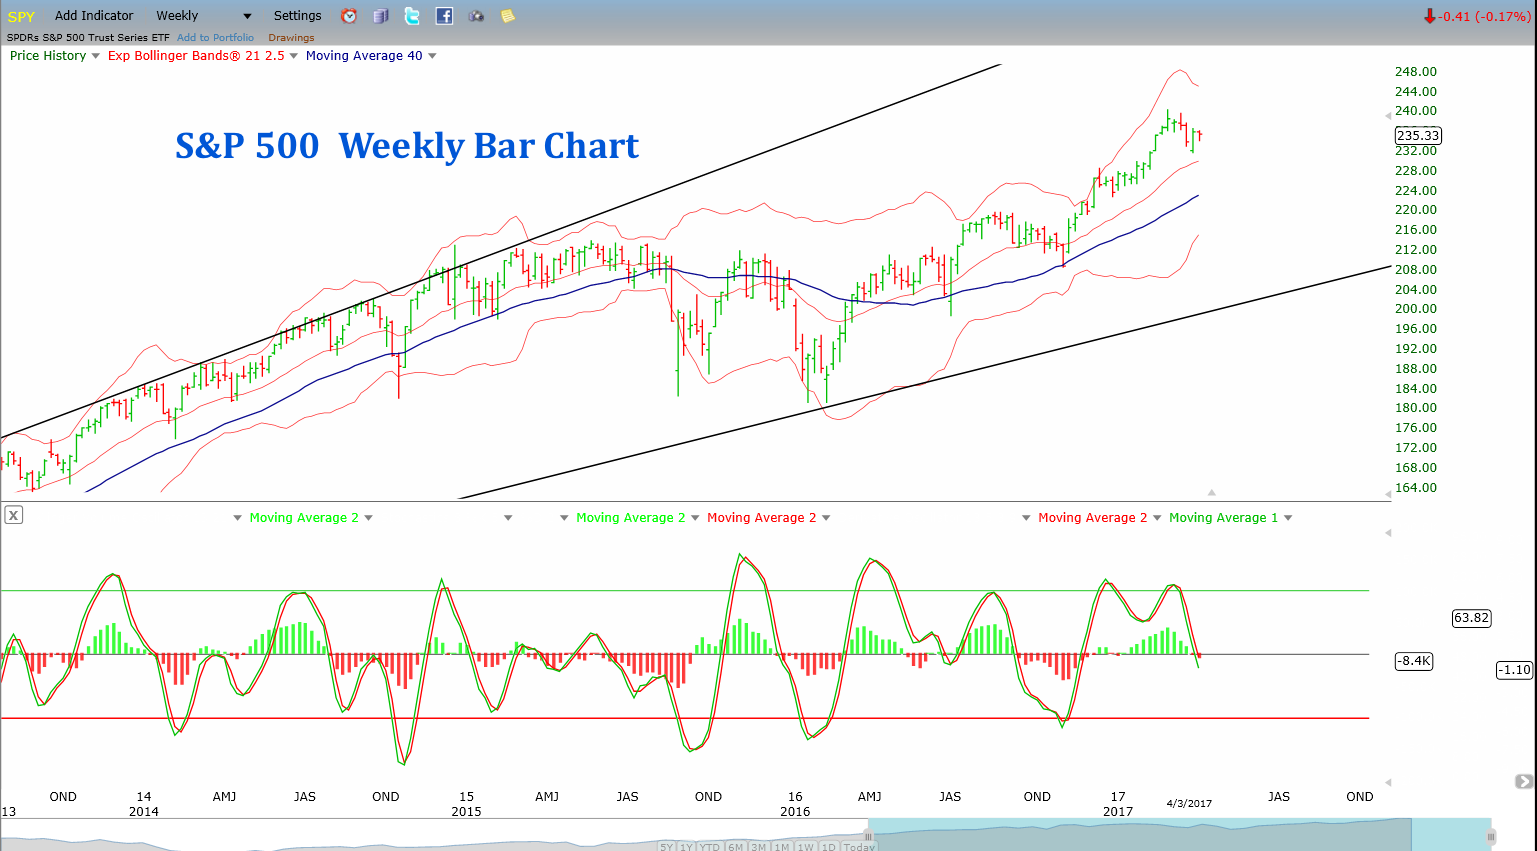
April expands the upside boundary of the band to roughly 2427.65 on the SPX but as I mentioned above, the analysis on what traders are doing combined with deteriorating sentiment points to a good chance for some more downside ahead. I do think that over the next month or so we will trade down to the 40 week simple moving average which is the blue line in the weekly chart below which roughly corresponds to the 200 day MA.
Taking a look at the daily chart below, the clear point of failure has been the 21 day MA. The past 3 sessions have been stonewalled at the 21 day which has turned lower. I mentioned last update that the market was settling into a 2 step forward 3 step back sort of pattern deteriorating further as we roll into April and I don’t see much to make me change my mind here.
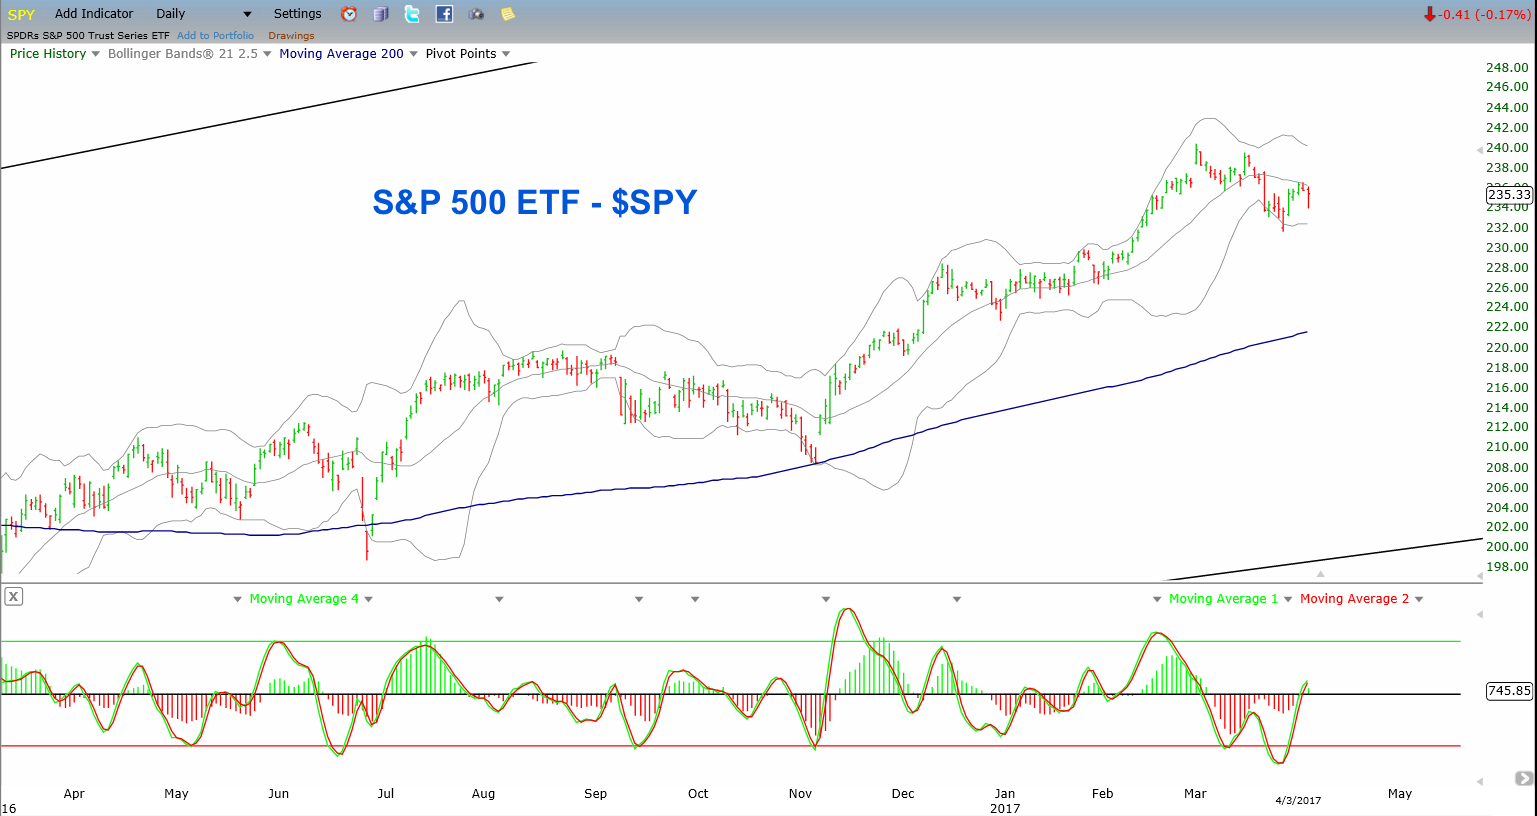
So before anyone slaps a bear tag on me let me state that I don’t foresee much more downside than another successful test of the 200 day SMA (40 week SMA) and another push forward. I don’t generally like to make longer term predictions because the longer the time horizon the greater the potential of unknown or poorly understood variables to emerge. I think the pace of fed hikes matter, I think the efficacy of the Trump administration in implementing their agenda matters and these are real important variables with very plausible opinions on how both negative and positive outcomes could affect markets. So bottom line here, I prefer to trade what’s ahead of me and deal with these situations as they present themselves to us over the coming months.
In that vein of trading what’s ahead, I still am of the opinion that the energy sector offers some good opportunities here and I am accumulating bullish positions in the following. XOM, HAL, OXY, RIG and SLB. I have on 50% of my allocation and will add on weakness this month. Again there are many others that look attractive as well in the broad energy sector.
As for the short side, here’s a little disclosure here: I don’t short stocks and haven’t in a while. Why? The bar has been set very high for shorting stocks, particularly what I trade which are large cap very liquid stocks. I prefer to trade opportunities on the long side and take advantage of the relentless bid this market has enjoyed over the past several years now. It is what it is, one day perhaps markets revert to what those of us that have been around beyond the past 8 to 10 years understand markets to be.
Thanks for reading.
Twitter: @CJMendes
Any opinions expressed herein are solely those of the author, and do not in any way represent the views or opinions of any other person or entity.

: Cup (and Maybe Handle) Watch")
 Trading Near Top Of Price Range")

