Stock Market Weekly Update: The Stampede Continues
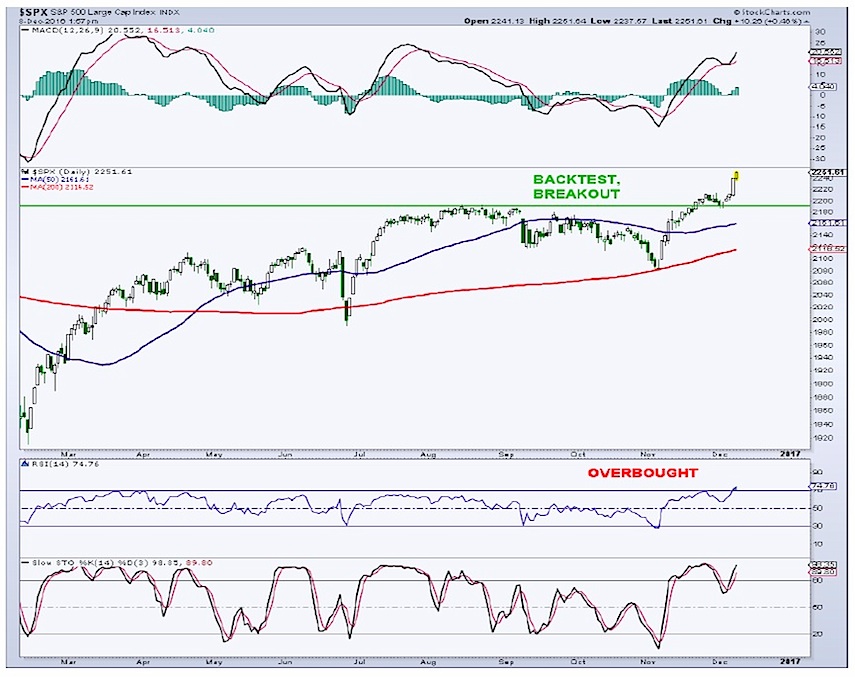
I have been looking for the proverbial mean reversion trade to take hold. And while on the one hand, there has been a little of that, the indices that I thought would take a breather keep storming higher. And the broad S&P 500 Index (INDEXSP:.INX) continues to be the bellwether that exemplifies this. And thus the December bull market rally continues…
I’ve been bullish for some time and my target 2300-2500 on the S&P 500 for early-mid 2017 remains. But we are getting stretched here.
Specifically, I have been looking for a respite in the iShares Russell 2000 ETF (IWM), the Financial Sector SPDR (NYSEARCA:XLF), and the Industrial Sector SPDR (NYSEARCA:XLI). While there was a pause in late November/early December, these ETF’s have rocketed to new highs. It would appear from afar that these ETF’s have little in common. Looking behind the scenes, and the connection becomes evident. Financials are the largest holding in the small caps ETF (NYSEARCA:IWM), making up over 19% of the ETF. Industrials are the third largest holding, making up almost 15% of the IWM.
So, call it what you want, but this part of the “Trump Trade” is connected at the hip, and until the hoopla ends, it has been up, up, and away.
To review how far these ETF’s are extended, and in other words, how close we are to the hoopla ending, at least in the near term, one needs to go no further than simple momentum. All three of these ETF’s have seen their 14-day RSI exceed 80, with the XLF’s RSI above 85. With regard to the financials, we’re talking about slow growing, mega cap stocks that rarely cause this much excitement. The XLF and IWM are currently posting some pretty obvious bearish momentum divergences, so the next couple of weeks should be interesting.
The lifeblood of any bull market can be summed up in one word – breadth. When more stocks are rising than falling, market breadth is said to be positive. Looking at the weekly chart of the NYSE common stock-only, advance – decline line, we see a very bullish breadth picture. This A/D line broke to a new high in July, and has been in an uptrend ever since.
The stock market is hitting new all-time highs as we speak. Making new highs is impressive in itself, especially considering that the NYSE Composite still has not printed a new high and remains slightly below its May 2015 high. When new highs in breadth precede new highs in price, it has historically been quite bullish for the intermediate- to long-term. Another way to dissect market breadth is to compare how the smaller stocks (troops) are doing relative to the larger mega cap stocks (generals). Since late- October, the troops have been leading the generals, that is, small stocks have been leading larger stocks, and historically, that is positive for the market from an intermediate-term standpoint. It illustrates that there is a larger appetite for riskier-type stocks or higher beta names as opposed to slower growing, higher dividend yielding equities, and safer investments.
You can reach out to me at arbetermark@gmail.com for premium newsletter inquiries, if interested.
I compare the S&P 500 equal weighted index (SPXEW) to the S&P 500 (SPX). I last mentioned this ratio in September or October, when it was heading lower. Below is the S&P 500 Chart, followed by a ratio chart of the two.
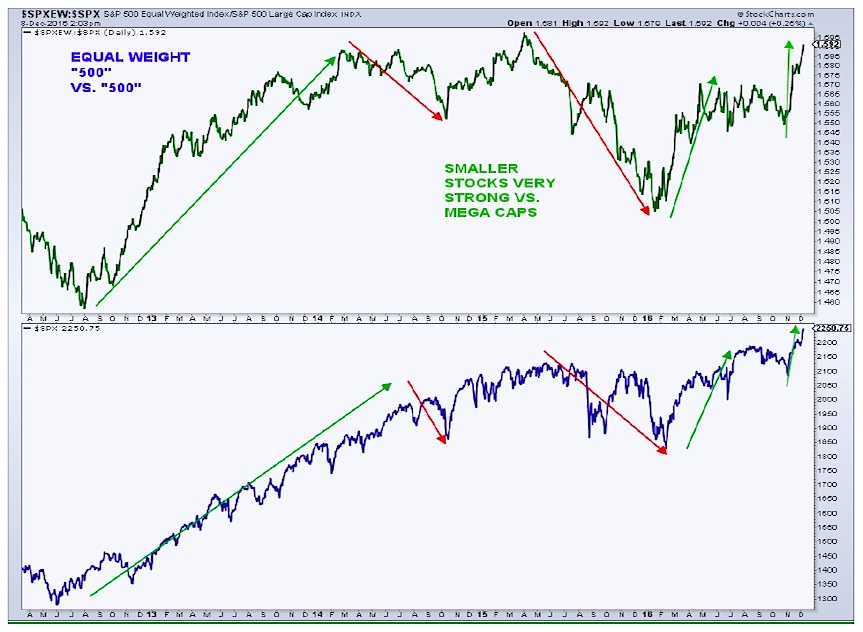
That eventually led to the selloff into the election. Sometimes, ratio charts can trace out their own technical patterns and what we see with the SPXEW/SPX chart is a breakout in mid-November from an inverse head-and-shoulders (H&S) formation. This bodes well for equities well into 2017.
Additional confirmation that the bull market has further to go comes from the NYSE advance – decline volume. This is just an AD line of NYSE volume as opposed to NYSE issues. The NYSE AD volume line broke to a new high in November after a long basing period. The volume line peaked back in April 2015, and dropped sharply into the February 2016 lows. Volume has now completed a one and a half year base, which also bodes well for equities.
continue reading on the next page…


