Last month I wrote two pieces on the importance of the Fibonacci Yr1 pivot point at 2120 S&P 500 (INDEXSP:.INX). The first post highlighted its importance and the second post showed why it may break down (head & shoulders pattern) and where we may be headed next.
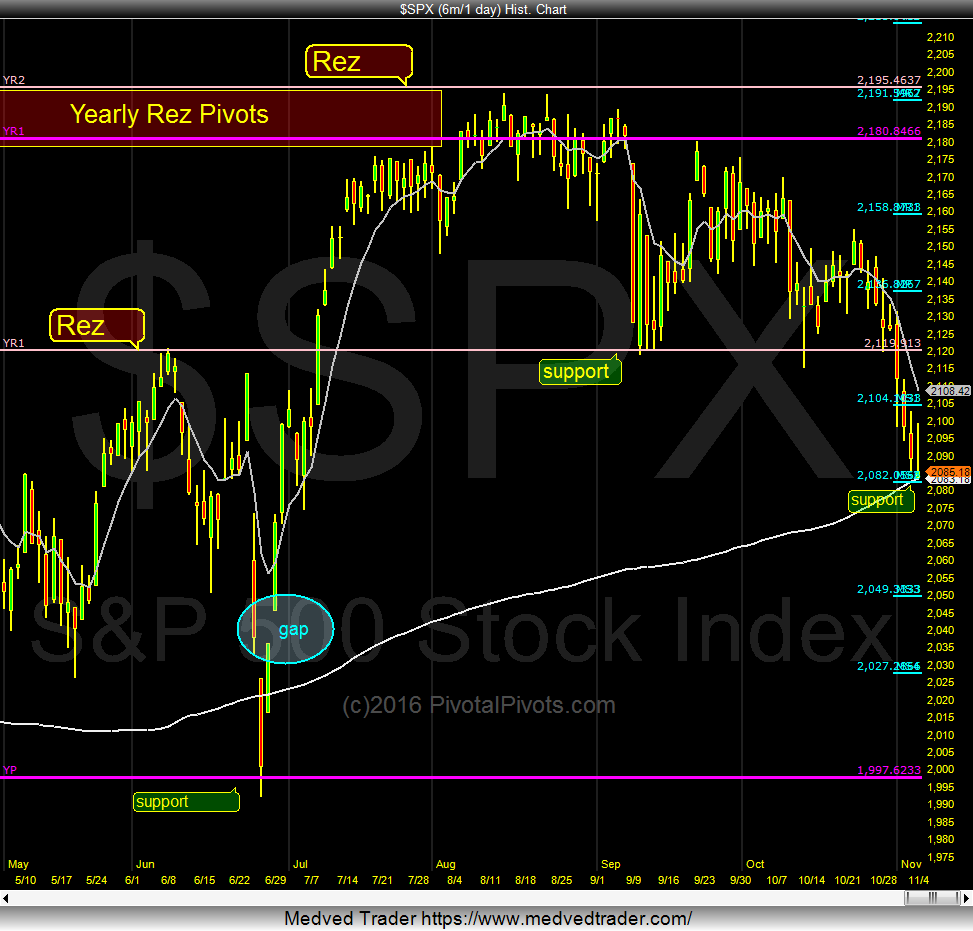
This past week price finally broke through that YR1 Pivot.
This brought about a test of short term support on Friday at the Ms2 Pivot Point and the 200 day moving average near 2082. That support has held thus far and futures are jumping higher in premarket.
Today’s bounce may back-test the Fibonacci Yr1 Pivot at 2120 S&P 500. This should now pose strong resistance for the S&P 500. How the market reacts around that level will be telling.
Another move lower would target 2082 again. And a close below 2082 this week would open the door for a Brexit retest on the Yearly Pivot(YP) at 1997.
This month PivotalPivots celebrates it’s 3rd year. I now have over 100 clients, including hedge funds, portfolio managers, and active traders. Thanks for reading.
Twitter: @Pivotal_Pivots
The author may have a position in mentioned securities at the time of publication. Any opinions expressed herein are solely those of the author, and do not in any way represent the views or opinions of any other person or entity.


