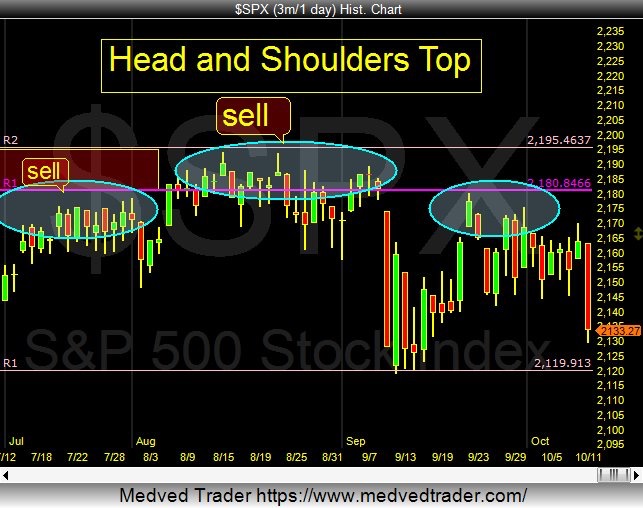
Over the past few weeks, I have written about the S&P 500 (INDEXSP:.INX) price support level of 2120 on two occasions. This is important because the market has had trouble breaking out to the upside, running into a confluence of resistance pivots at the floor traders R1 pivot (2181) and the Fibonacci R2 pivot (2195). And this has created the trading range we’ve seen over the past few weeks.
But the stakes are high right now as an S&P 500 head and shoulders pattern has formed, showing 2120 as an important support level.
2120 is also the Fibonacci R1 trading pivot. And, in my eyes, 2120 marks the trading line in the sand for Bulls. A close below 2120 may open the door for a Brexit low retest of the Yearly (P) Pivot at SPX 1997.
Not all head and shoulders are created equal, so keep an eye on 2120!
S&P 500 Chart
Thanks for reading.
Twitter: @Pivotal_Pivots
The author may have a position in mentioned securities at the time of publication. Any opinions expressed herein are solely those of the author, and do not in any way represent the views or opinions of any other person or entity.


