Today’s trading outlook looks at S&P 500 futures, Nasdaq futures, and Crude Oil futures for June 3, 2016.
Focusing on S&P 500 futures, we see that the market moved higher into the employment numbers. My thought is that if the number is a negative surprise, the dip will be into support that holds at the first pass. A significant amount of divergence is showing but as long as these moving averages hold us up, we’ll continue to bounce off support regions. More on the lower support regions below.
On the upside, the levels of resistance are 2106.5 to 2112.5 – they continue to loom large as resistance.
See today’s economic calendar with a rundown of releases.
THE RANGE OF TUESDAY’S MOTION
E-mini S&P 500 Futures (ES_F)
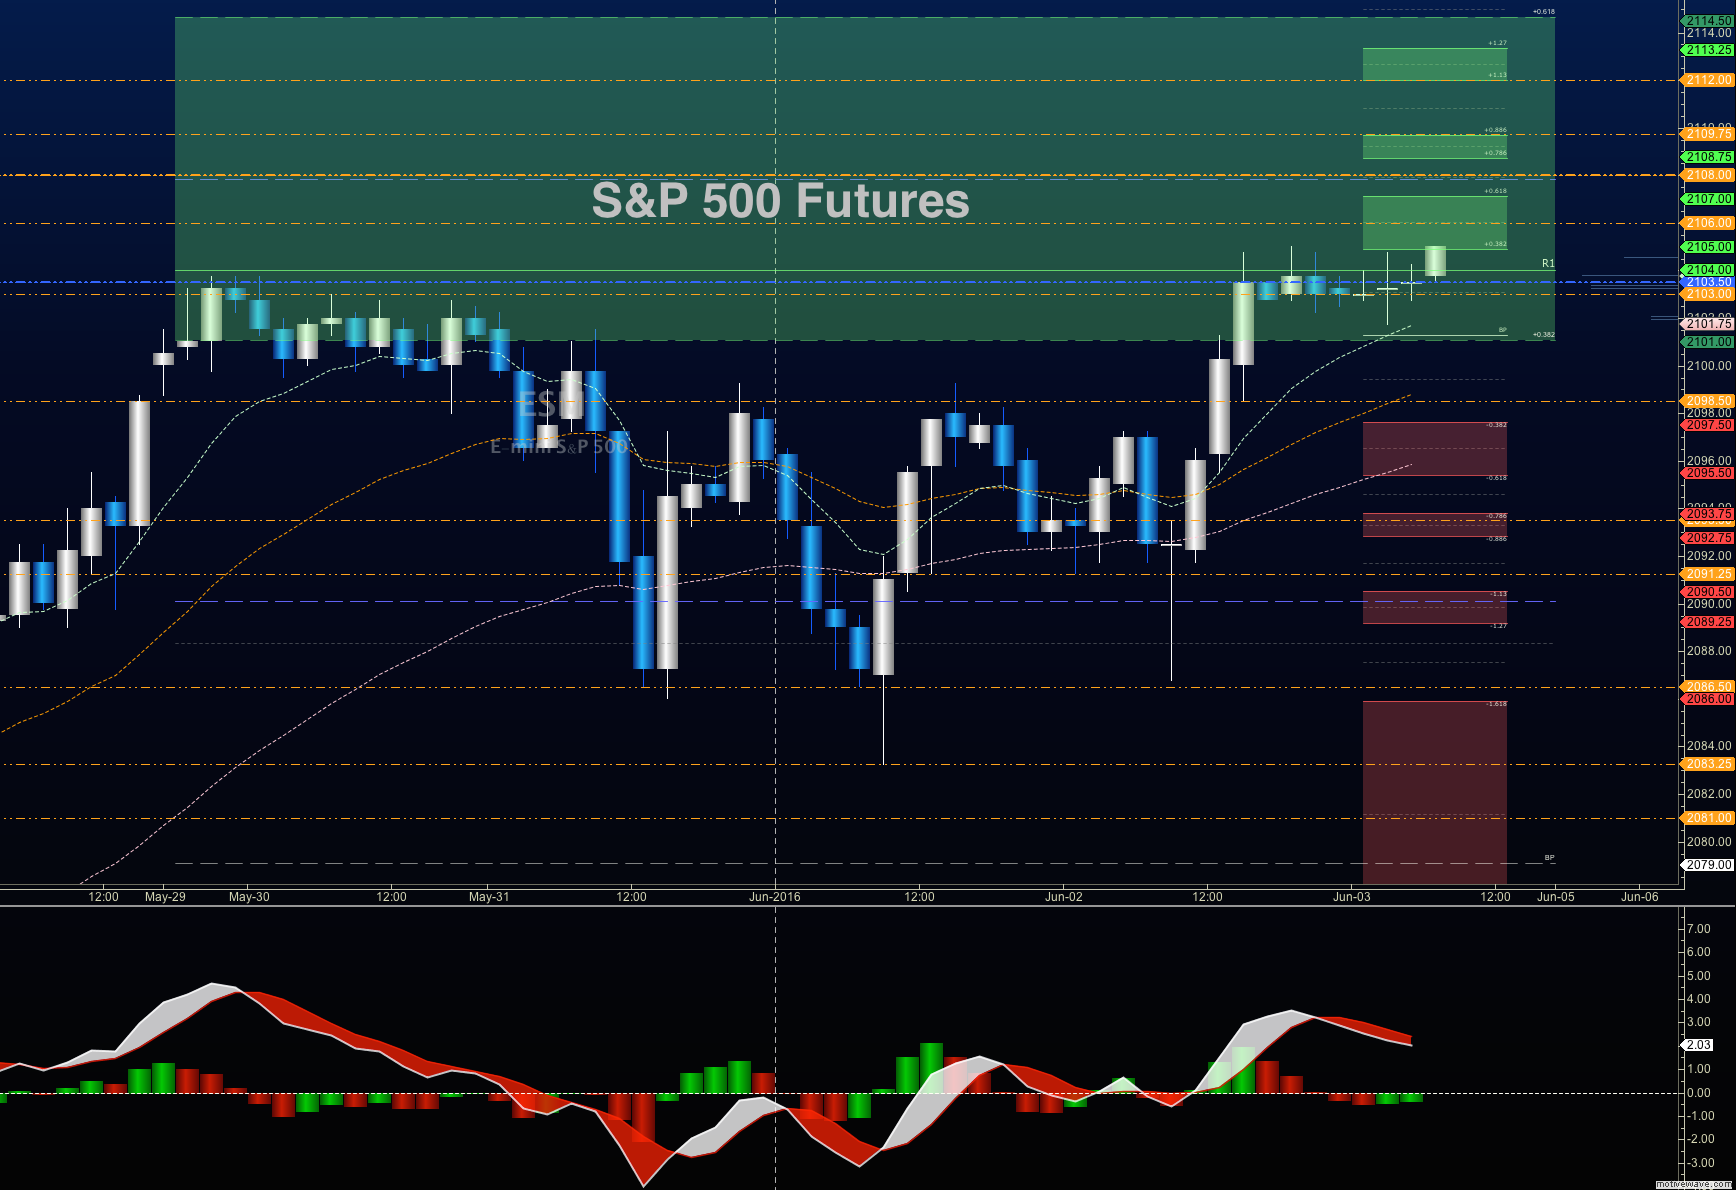
S&P 500 trading outlook for June 3, 2016 (ES_F futures) – Employment situation, factory orders, ISM non-mfg make today interesting. Momentum is mixed – holding in positive territory, but showing signs of weakness on the price action upward. I suspect this means more of the same – big wicks if we dip south – meaning buyers still rescue the charts on deep support tests.
Upside trades on S&P 500 futures – Favorable setups sit on the positive retest of 2099.25, or a positive retest of 2103.5 with positive momentum (this does not currently exist). I use the 30min to 1hr chart for the breach and retest mechanic. Targets from 2099.25 are 2101.5, 2103.5, 2105.75, 2106.5, and if perhaps 2110.25, and 2105.25 to 2112.5, if the shift of balance remains with the buyers.
Downside trades on S&P 500 futures – Favorable setups sit below the failed retest of 2102.5 or at the failed retest of 2105 with negative divergence. It is important to watch for higher lows to develop with the 2105.5 entry, if the strength of motion holds with the buyers. Retracement into lower levels from 2105.5 gives us the targets 2102.5, 2099.5, 2096.25, 2094.25, 2092.5, 2090.5, 2088.5, 2085.5, 2082.25, 2078.5, and perhaps back to 2077.5 to 2075.
Have a look at the Fibonacci levels marked in the blog for more targets.
Nasdaq Futures
Outlook for Nasdaq futures for June 3, 2016 – Nasdaq futures (NQ_F) remain range bound. Significant overhead supply now sits between 4535 and 4564. Expansions to the north seem likely as buyers continue to drive sellers out of the way, but weaker momentum sits below, so trades should be into target. Bearish action will be amplified below the failed retest of 4524, but the first break down will find buyers in a bounce to resistance. The failed resistance test at 4522 allows for further downside exposure.
Upside trades on Nasdaq futures – Favorable setups sit on the positive retest of 4534.25, or a positive retest of 4524.5 with positive momentum. I use the 30min to 1hr chart for the breach and retest mechanic. Watch for the lower high to develop, and sellers to force the chart down, if sellers take hold near the 4514 test from below. Targets from 4524.5 are 4528.25, 4535.5, 4544.75, 4550.75, and 4555.25. Range expansions above here should fail, but could stretch into 4562-4580.
Downside trades on Nasdaq futures – Favorable setups sit below the failed retest of 4520.5 or at the failed retest of 4531 with negative divergence. Retracement into lower levels from 4531 gives us the targets 4528.5, 4524.75, 4520.75, 4516.5, 4511.5, 4508.5, 4502.5, 4497.5, 4479.5, 4472.25, 4464.75, 4451.25, and perhaps 4434.5 – but those deep levels only come about if we have a real shift of momentum.
Oil
Outlook for crude oil futures for June 2, 2016 – Movement is stagnant as traders continue to digest this upside move in crude oil. Momentum is flat so we seem to be sitting in a range bound formation.
The trading range for crude oil suggests support action near 47.7, and resistance behavior near 49.98.
Upside trades in crude oil futures can be staged on the breach of 49.46, or at a pullback into 48.98. If the chart dips sharply into 48.4 again, buyers will lurk there as well. Watch carefully for resistance ahead near the entry at 48.98. I often use the 30min to 1hr chart for the breach and retest mechanic. Targets from 48.4 are 48.63, 48.82, 49.04, 49.14, 49.32, 49.57, 49.74, 49.97, and 50.04. Range expansion could occur here if buyers exercise real pressure, or if stops start getting triggered. Those resistance levels above are 50.6, 50.92, and 51.41, but price is very likely to fail on any range expansion, especially if it is due to squeezing action on the stops.
Downside trades in crude oil futures can be staged on the failed retest of 48.94, or at the failed retest of 49.41 with negative divergence. Again, we can also look for exhaustion moves north, but with eyes on higher support coming in to push the chart upward. These setups give us targets from 49.4 into 49.11, 49.98, 48.86, 48.7, 48.49, 48.27, 47.97, and perhaps 47.68 to 47.24.
If you’re interested in the live trading room, it is now primarily stock market futures content, though we do track heavily traded stocks and their likely daily trajectories as well – we begin at 9am with a morning report and likely chart movements along with trade setups for the day.
As long as the trader keeps himself aware of support and resistance levels, risk can be very adequately managed to play in either direction as bottom picking remains a behavior pattern that is developing with value buyers and speculative traders.
Twitter: @AnneMarieTrades
The author trades stock market futures every day and may have a position in mentioned securities at the time of publication. Any opinions expressed herein are solely those of the author, and do not in any way represent the views or opinions of any other person or entity.


