Broad Stock Market Overview for August 1, 2018
The broader stock market bounce is fading off resistance following news of more China tariffs. As well, the market will have to deal with a Federal Open Market Committee meeting.
Wider timeframes are still supportive for the S&P 500 (NYSEARCA: SPY) and Nasdaq (NASDAQ: QQQ) but bulls have yet to regain full confidence in this bounce. Careful around edges of price support for bounces that fail (see support and resistance levels below). Deeper dips should continue to find buyers.
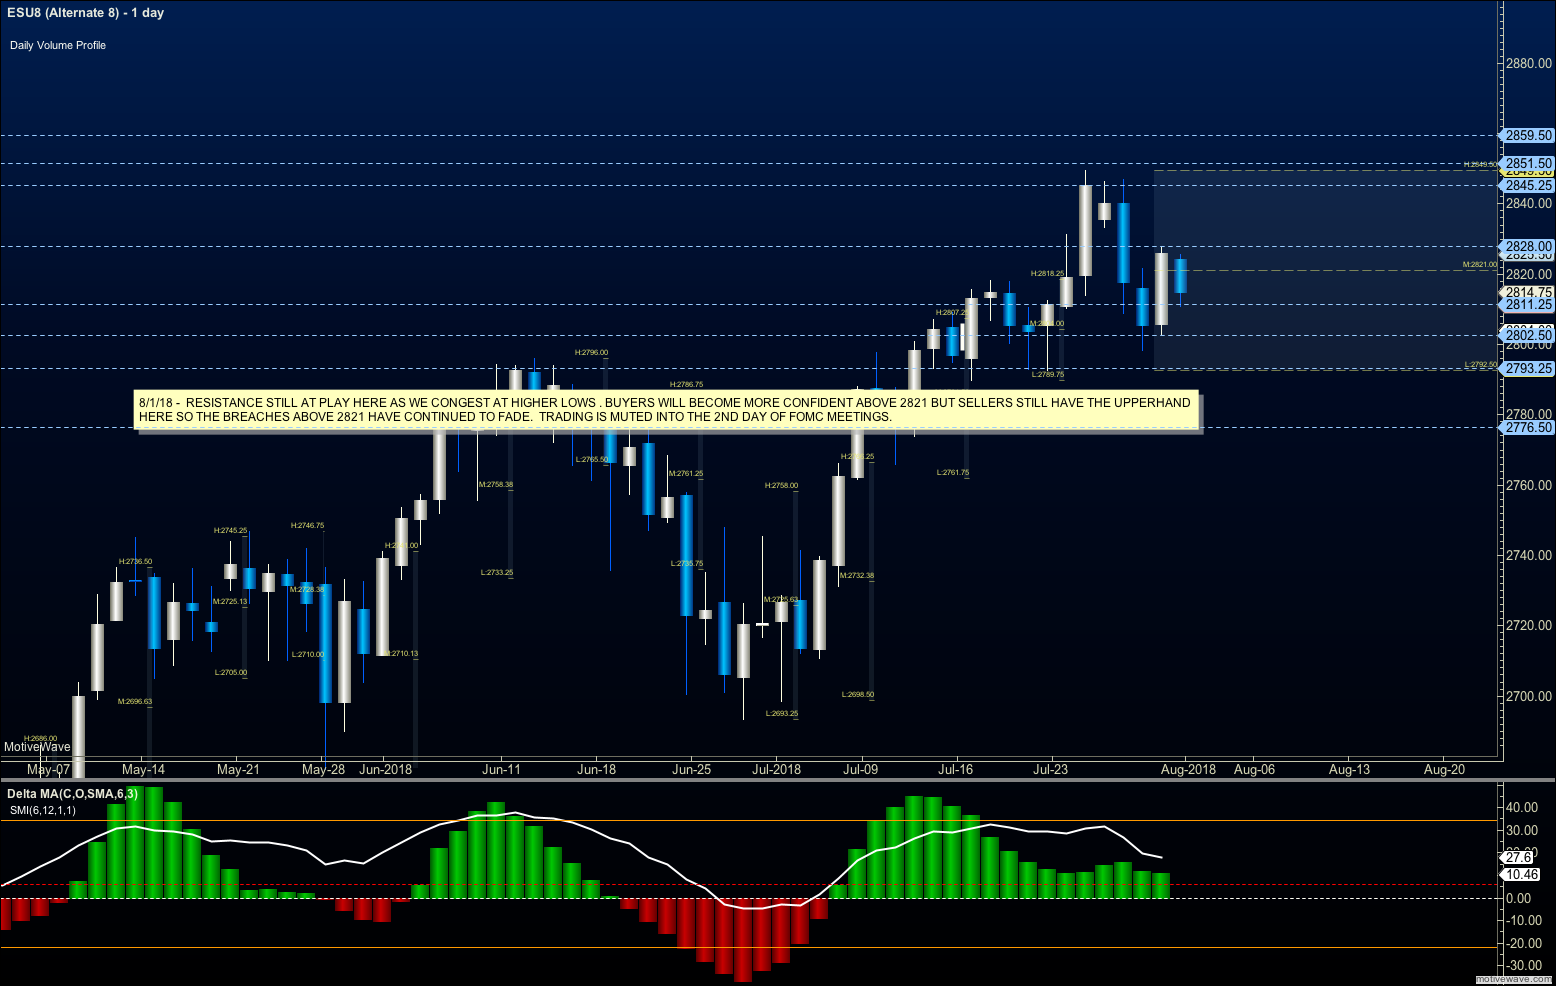
S&P 500 Futures
Resistance tests at 2821 failed after buyers attempted a hold.
Today, the traders are holding 2810 as support intraday but are quiet into the FOMC meeting in progress. Breaching 2821 once more could certainly give buyers a push upward but buying the breakout would be a risk event that requires that you estimate your exposure if you are going to stay long through any potential whipsaw. The bullets below represent the likely shift of intraday trading momentum at the successful or failed retests at the levels noted.
- Buying pressure intraday will likely strengthen with a bullish retest of 2827.5
- Selling pressure intraday will likely strengthen with a bearish retest of 2808.75
- Resistance sits near 2825.75 to 2828.25, with 2834.75 and 2844.75 above that.
- Support sits between 2810.75 and 2804.5, with 2798.25 and 2794.75
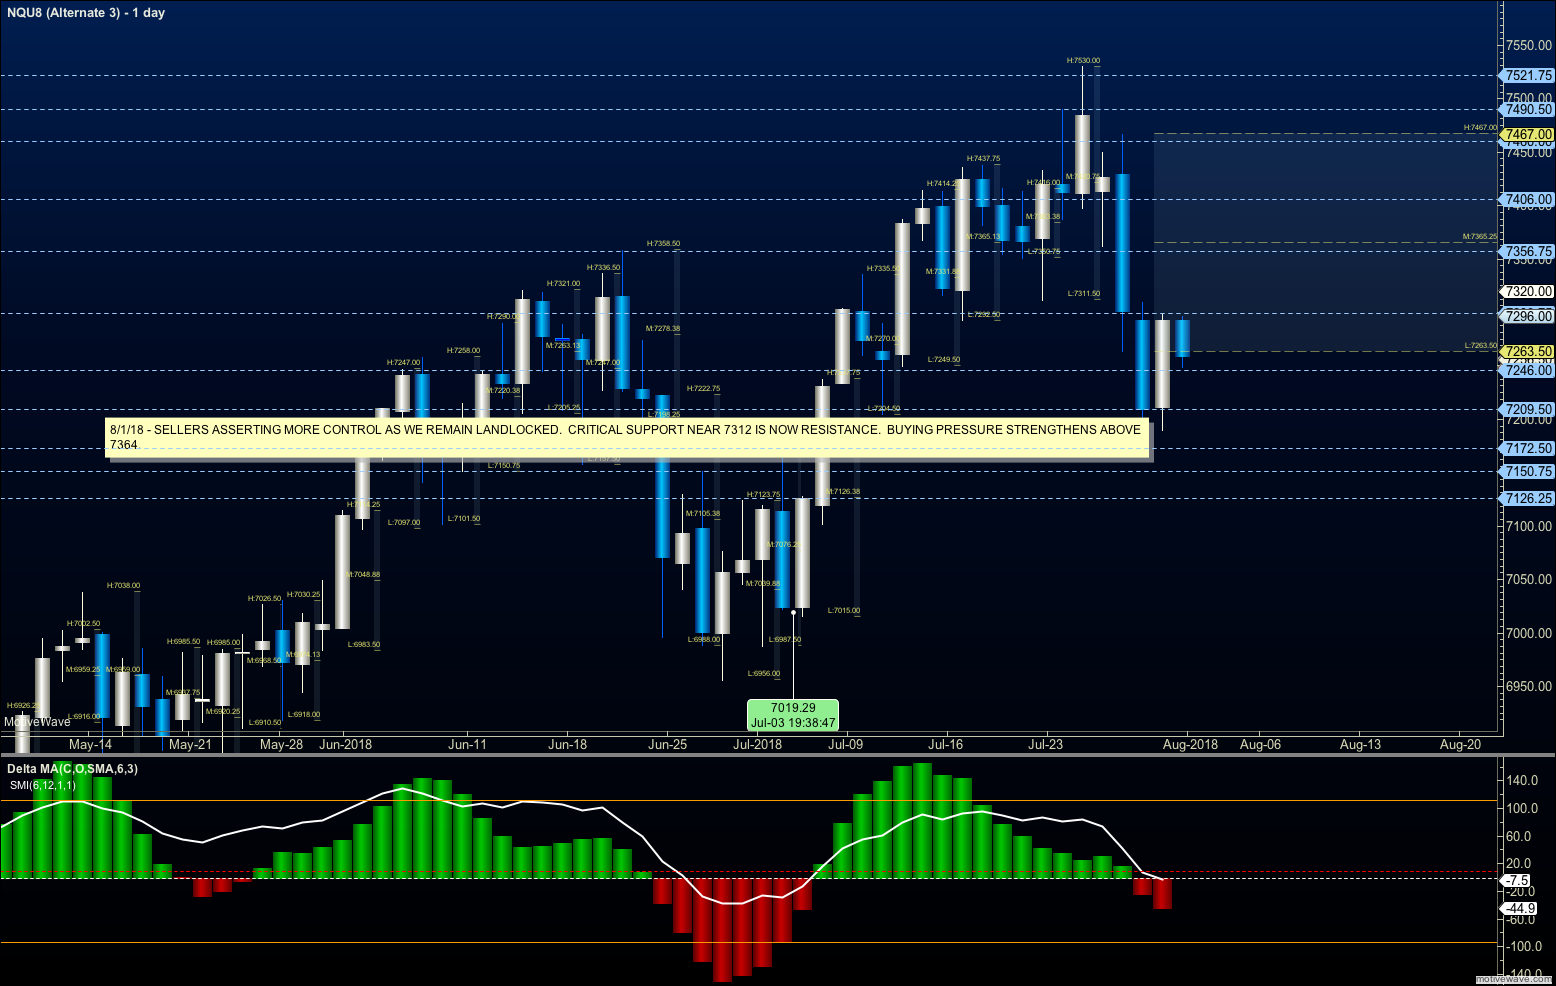
NASDAQ Futures
Buyers are struggling to recapture strength as fades into support holds. The level near 7260 is now a battleground between buyers and sellers from an intraday perspective. Traders are still working through the thin volume profiles but holding the regions that still give buyers a shot at keeping wider bullish time frames intact. Swing traders need to wait for this to settle out before taking long trades as thin volume profiles still deep in the territory all the way down to 7089. The bullets below represent the likely shift of intraday trading momentum at the successful or failed retests at the levels noted.
- Buying pressure intraday will likely strengthen with a bullish retest of 7296.75
- Selling pressure intraday will likely strengthen with a bearish retest of 7246.5
- Resistance sits near 7276.5 to 7291.5 with 7311.5 and 7320.25 above that.
- Support sits between 7260.5 and 7246.75, with 7226.5 and 7208.75 below that.
WTI Crude Oil
Sellers forced price deep into lower congestion as traders wait for the release of EIA numbers today. Momentum is neutral to bullish as we fade more deeply into support, increasing the likelihood of a bounce event in the current formation. Intraday direction remains negative so it is likely that buyers are being cautious into the fade. Not a good place to catch the falling knife until the recapture of higher lows from an intraday space (use a 3200-5000 tick there). The bullets below represent the likely shift of intraday trading momentum at the successful or failed retests at the levels noted.
- Buying pressure intraday will likely strengthen with a bullish retest of 68.27
- Selling pressure intraday will strengthen with a bearish retest of 67.53
- Resistance sits near 68.44 to 68.89, with 69.04 and 69.64 above that.
- Support holds near 67.79 to 67.54, with 67.25 and 66.79 below that.
Twitter: @AnneMarieTrades
The author trades stock market futures every day and may have a position in mentioned securities at the time of publication. Any opinions expressed herein are solely those of the author, and do not in any way represent the views or opinions of any other person or entity.
: Creating Bullish Divergence?")

 and Semiconductors (SMH): Concerning Price Pattern?")
 and Semiconductors (SMH): Concerning Price Pattern?")


