Broad Stock Market Trading Overview for July 26, 2018
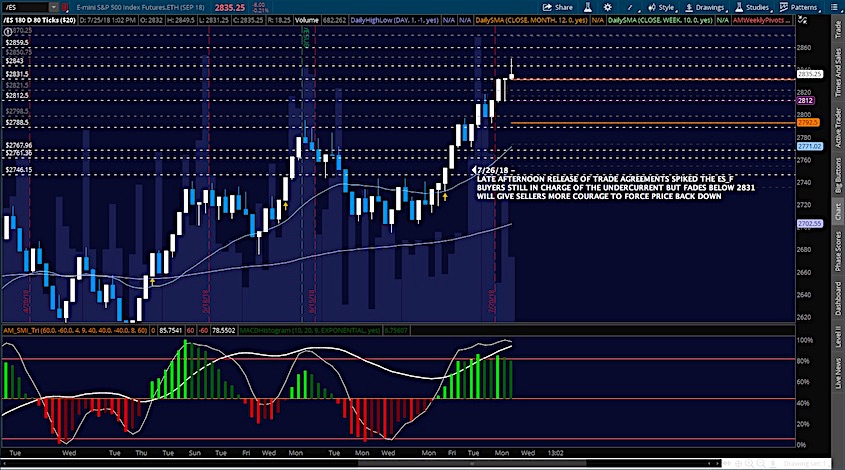
If you look at the Nasdaq futures chart in the blog yesterday, you will see the commentary on ‘giants’ moving the Nasdaq (INDEXNASDAQ:.IXIC) and the risk of contagion in a misstep by one of them. See Nasdaq and S&P 500 (INDEXCBOE:.INX) levels below.
This was Facebook (NASDAQ:FB) yesterday with a disappointing earnings release that also warned for future guidance. On the bright side, support levels are holding and trade deals released after the close do have us holding higher lows.
Buyers remain in control though spikes (up or down) could be steep as so much of the movement was in low volume and after the close of retail trading hours.
Bullish formations prevail as we sit in a shallow dip off the spike from the trade deal with the EU being released across the wires.
There is an undercurrent of pressure that suggests buying the breakouts remains a poor exercise in risk management at this time. The bullets below represent the likely shift of trading momentum at the successful or failed retests at the levels noted.
- Buying pressure intraday will likely strengthen with a bullish retest of 2842.5
- Selling pressure intraday will likely strengthen with a bearish retest of 2828.75
- Resistance sits near 2846.75 to 2851.25, with 2854.75 and 2859.75 above that
- Support sits between 2829.75 and 2821.75, with 2816.75 and 2811.75
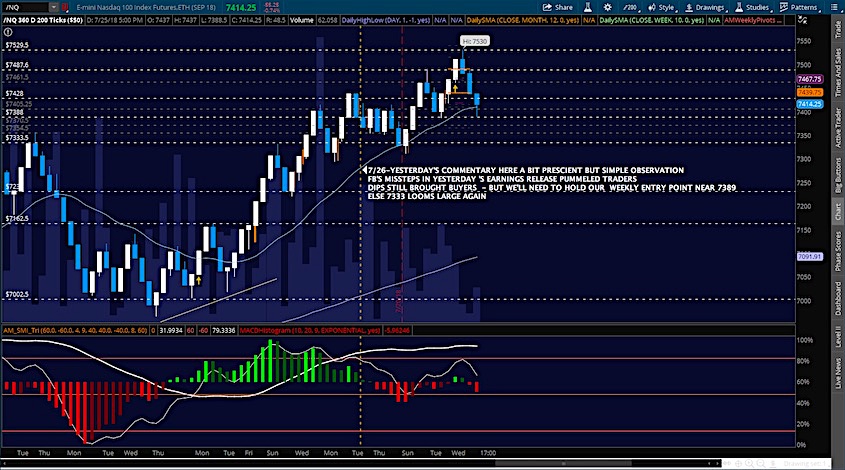
NASDAQ Futures
Breakouts failed dramatically after the FB earnings release after a move to new highs. That said, our supports are holding near 7388 after a fade more than 240 points deep. That’s a volatile space – likely due to contagion from Facebook. The levels near my 7388 will be the line in the sand intraday. Because we have moved so quickly for yet another day, we do need to be alert to price reversals here that could take us spiking higher in recovery as traders have been rewarded by buying these deep dips. The bullets below represent the likely shift of trading momentum at the successful or failed retests at the levels noted.
- Buying pressure intraday will likely strengthen with a bullish retest of 7428.75
- Selling pressure intraday will likely strengthen with a bearish retest of 7388
- Resistance sits near 7446.5 to 7461.5 with 7487.5 and 7514.25 above that.
- Support sits between 7397.5 and 7388.75, with 7370.5 and 7354.5 below that.
WTI Crude Oil
Buyers hold price grinding in an upward channel. Momentum is shifting to bullish as the line in the sand shifts upward to 68.9. Pullbacks will be buying regions for the chart. The bullets below represent the likely shift of trading momentum at the successful or failed retests at the levels noted.
- Buying pressure intraday will likely strengthen with a bullish retest of 69.57
- Selling pressure intraday will strengthen with a bearish retest of 68.95
- Resistance sits near 69.36 to 69.84, with 70.24 and 70.54 above that.
- Support holds near 69.06 to 68.79, with 68.58 and 68.16 below that.
Twitter: @AnneMarieTrades
The author trades stock market futures every day and may have a position in mentioned securities at the time of publication. Any opinions expressed herein are solely those of the author, and do not in any way represent the views or opinions of any other person or entity.

: Worrisome to Broader Market?")

