S&P 500 Futures: (2-3 Days) – Bullish
Tests of all-time intra-day highs from March 1 are directly above for the S&P 500 (INDEXSP:.INX). S&P 500 futures came within a few points, and this area is likely to be tested and exceeded before any type of market peak is in place. Short-term trends have improved, and while momentum is overbought on hourly charts, we aren’t quite there yet on daily. This suggests that further upside still lies ahead.
TECHNICAL THOUGHTS
Bottom line: The near-term trend turned sharply positive and has improved since Monday’s breakout, and while a possible stallout “could” happen near early March highs (which lie just above current levels as of Tuesday’s close) structurally the indices are in better shape than a few weeks ago, and further movement back to new high territory looks likely before any meaningful reversal. Momentum is trending higher, but not overbought on daily charts, and while Demark TD Sequential signals are now present (but not confirmed) on daily S&P 500 charts (and S&P 500 June Futures), the weekly signals remain at least 2-3 weeks away at a minimum, and lining up the Daily and weekly is a very important step in the process when trying to use counter-trend gauges to signal tops in the indices.
Both Financials and Industrials have shown better relative strength in the rolling 5-days, something which is seen as a positive during a time when many continue to complain about the lackluster breadth and low volume. While volume has certainly not been heavy over these last couple days, it has improved over levels seen in early April. The defensive sectors have since begun to be sold, while Treasury yields have started to creep back higher, with TNX climbing above Monday’s highs to end up near 2.33%.
Investor sentiment seems to be a key piece to the puzzle, and the BaML global fund manager survey offers a few clues in this regard. Profit expectations are near seven-year highs while global economic growth expectations are near two-year highs, both far different and more optimistic than what was seen this time last year. However, the exposure to US stocks has dropped considerably in favor of European and Emerging market exposure. While Fund managers have increased their long exposure to Global equities to 40% overweight (up from 5% in February 2016), they’re underweight US Equities by -20%, “the lowest US exposure since 2008″(Urban Carmel). Given that AAII sentiment still shows more Bears than Bulls, and we saw Equity put/call jump substantially during the 4/13 touch of 2322, there still seems to be plenty of skittishness in this market.
Since that time this week’s two-day surge has resulted in VIX plummeting down to under 11 from readings over 16 back in mid-April a near 33% plunge in just two week’s time as many rushed to sell implied volatility following Macron’s Stage 1 win in the French Elections.
Overall, with cries of “blow-off top” being heard around the Street, and everyone still caught up in anxiety about Trump’s First 100-days, Election uncertainty, Policy confusion with rates having plummeted since mid-March and Earnings, the recent strength in equities doesn’t seem like something to “fade” right away, and could lead back to new highs before any type of peakout in late Spring/early Summer.
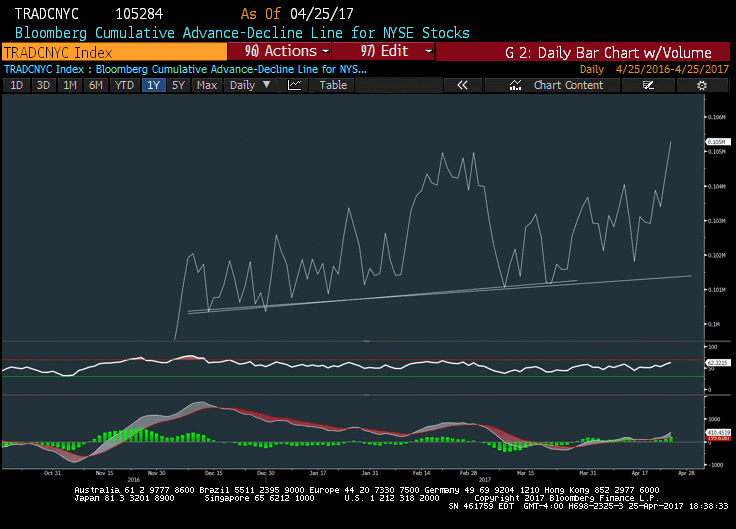
Market Breadth – A/D Line

Advance/Decline has moved back to new high territory as seen by this Bloomberg Cumulative Advance/Decline line for NYSE “Stocks Only”. This is an important step in the process, as most Spring peaks tend to happen after breadth has dropped off measurably. While the Percentage of stocks above their 50-day ma had dropped down to near 50% last week, seeing advance/decline move back to new highs is a definite vote of confidence for US stocks.
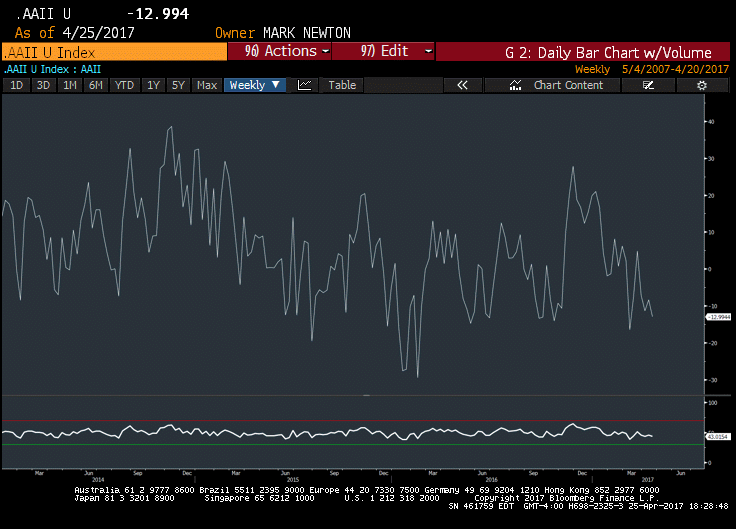
Investor Sentiment – AAII

Sentiment continues to reflect far more bearish readings than what might be expected after seeing the recent 30% + plunge in implied volatility. The spread between Bulls and Bears in AAII remains negative as of Thursday 4/20/17 ahead of this past Weekend’s election. This goes hand in hand with the April BaML Global fund managers survey showing -20% underweight positioning in US Equities by global fund managers, and signals that there continues to be a healthy level of skepticism regarding US Stocks. While optimism has in fact increased since last year, it doesn’t seem to be anywhere near Uber-optimistic levels that would suggest investors are all that ebullient.
Thanks for reading.
Get more of my ideas and daily trading insights over at Newton Advisor. Thanks for reading and good luck out there!
Twitter: @MarkNewtonCMT
Any opinions expressed herein are solely those of the author, and do not in any way represent the views or opinions of any other person or entity.


