The last week in the stock market reminds me of the original Batman series that I watched everyday after school. WHAMM! RIP! KERPLOP! BANG! You know what I’m talking about if you were born in the 50’s or the 60’s. The bulls went RIP! And the bears went KERPLOP!
Well, maybe Batman and the Boy Wonder knew a thing or two about a bear market rally. Holy Upside Reversal Batman!
Would you believe me if I told you that there was a similar move in stocks in September/October of last year? Which was also after a successful test of a new low? That rally led to a 12% advance in a little over a month before the S&P 500 Index rolled over and died.
Another potential analogy where we saw tremendous short-term strength within the context of a downtrend was back in November 2008. There was a five-day bear market rally, with three days closing strong and near their highs for the day. That bear market rally produced a 19% surge (bull market in 5 days – LOL) before rolling over to new bear market lows.
There is another time period when the S&P 500 traced out a double bottom within the confines of a downtrend and that was January to March of 2008. Interestingly, and something I have pointed out many times, is that many of the intermediate-term buy signals we saw at last year’s double bottom as well as this year’s double bottom also occurred during the 2008 period.
S&P 500 Chart – The 2008 Bear Market
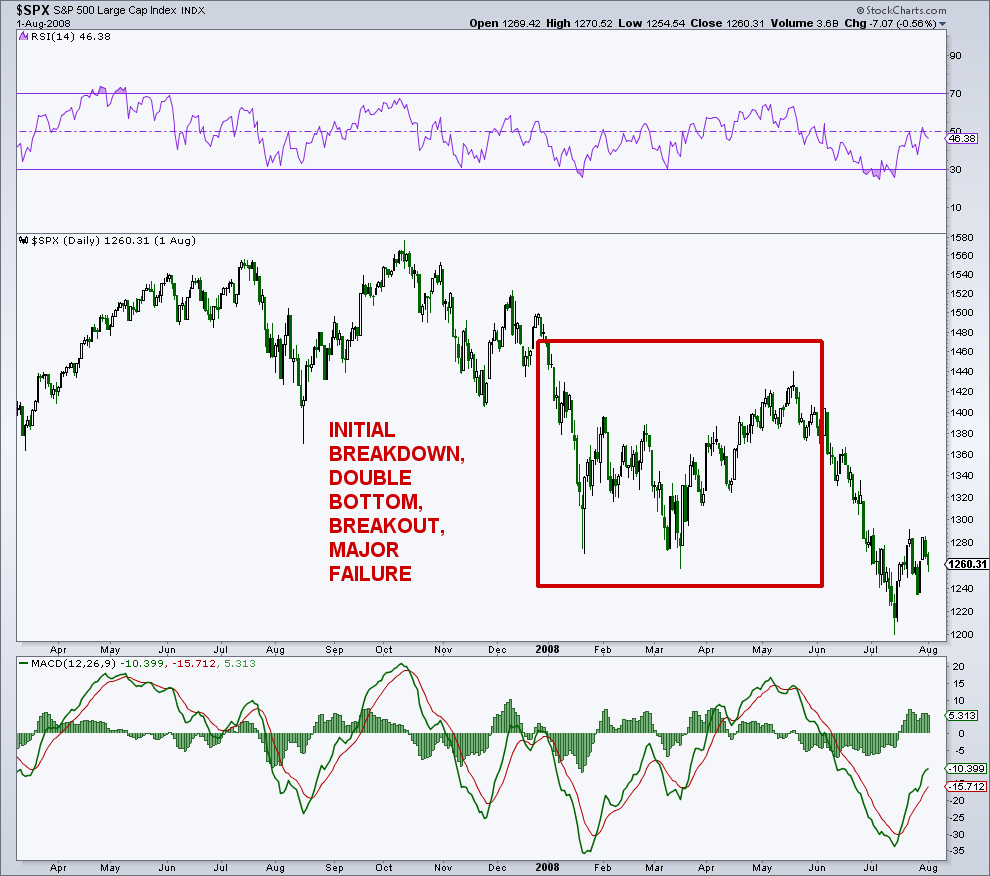
This is why I have been cautious about calling these rallies anything more than bear market affairs. Of course, these buy signals based on momentum, internals and sentiment also occur during major corrections in bull markets (2011 for example), so one never knows for sure whether to label this price action a bear market or a major correction in a bull market. Certainly it has been a stealth bear market (labeled by me last year), with the majority of stocks giving up 20%+ from their 2015 highs.
Anyway, the double bottom in 2008 also produced a 12% bear market rally over a two-month period before rolling over and morphing into the financial collapse. I am not looking for a third massive bear market of 50%+, just a garden-variety bear market (20% to 30%) back to the 1,500 to 1,600’s area. Hey, Ms. Market will do what she wants. It’s up to the technician to adapt.
I will say that it’s almost unbelievable that we have not yet seen a 20% decline in the S&P 500 with the incredible and wide scale damage to so many industries, sectors, and individual stocks. What we have seen is rolling rotational weakness sprinkled in with some throw the baby out with the bath water activity that does not last long enough to send the “500” into the teeth of the bear. And just when it seems the bears will seal the deal, we get another bear market rally.
It began with a top in energy and material names back in 2014. The carnage here has been pretty consistent with intermittent attempts at bottoms. The transportation stocks rolled over in early 2015 along with the industrials. The biotechnology stocks, the leaders of this bull market, finally succumbed to the heights and rolled over in the middle of 2015 as did the small and mid caps. The financials and the “FANG” stocks cratered at the end of 2015 into this year.
Where did all this money go? Some, maybe a lot, came out of the market and went into cash and treasuries. There was a rotation into defensive stocks and sectors like consumer staples and utilities. These rotational forces are the lifeblood of a bull market and so far, have prevented any carnage in the mega cap indexes. Bear markets are when money exits stocks and moves to cash and treasuries (and under the pillow) with little rotation among sectors. So far, that puke or give phase on stocks has not been enough to knock the crumbling building down quite yet.
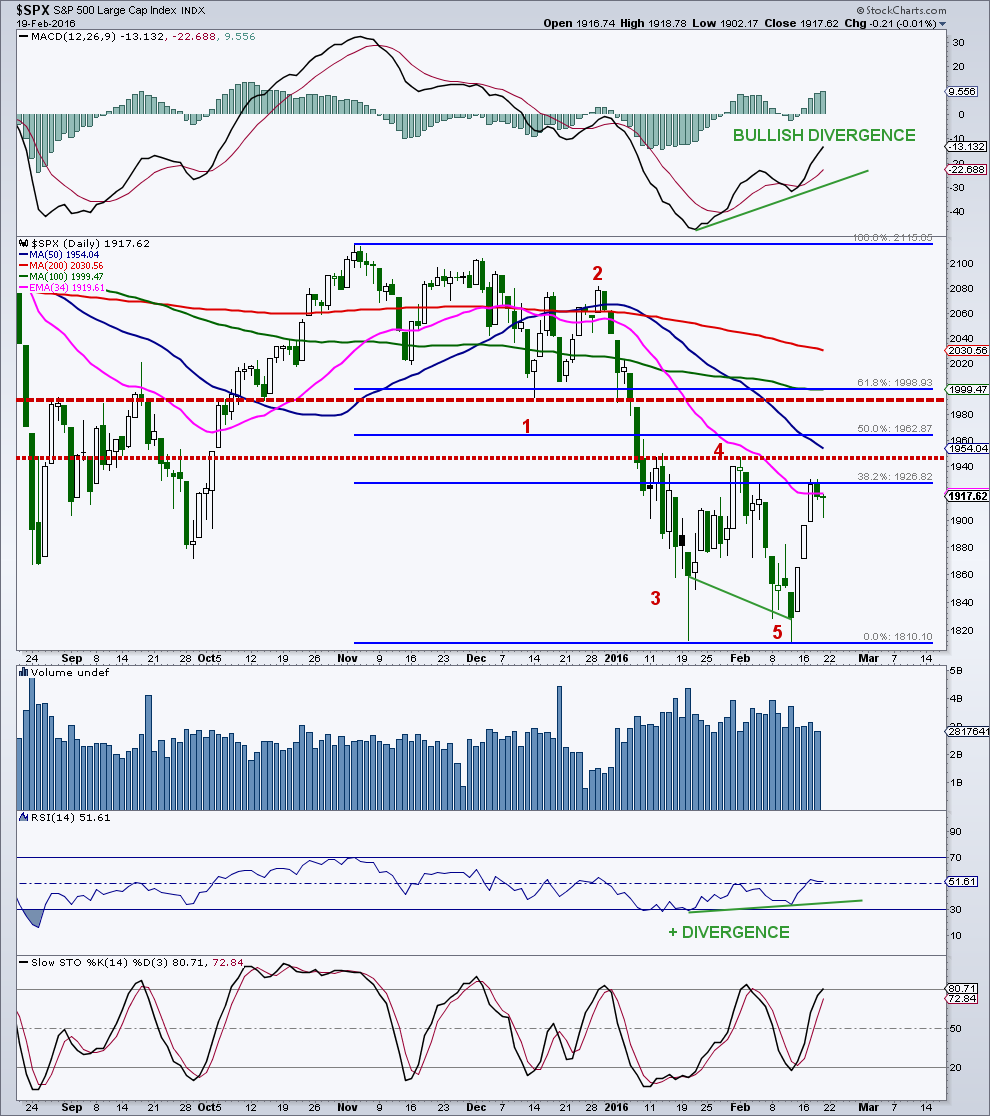
In the short term, the S&P 500 rallied up to the first potential piece of technical resistance in the 1,927 area. This is a 38.2% retracement of the decline from early November to the recent low this month. If this is the end of the first wave higher in a 3-wave advance, then we should see a decent pullback back to the 1,870/1,880 region before the next and final wave higher. There are a couple of gaps on the “500” chart in the 1,897 and 1,870 zones that might get filled.
On the upside, chart resistance sits at the interim double bottom peak of 1,947, which we might see to complete this first wave higher of the bear market rally. Above 1,947 is where things get interesting. A 50% retracement targets the 1,963 level, while a 61.8% take back sits up at 1,999. The 2,000 area is quite important as it represents the breakdown level of the recent decline.
In addition, the zone has represented both support and resistance many times over the past 20 months. It will also represent the location of the rounded top looking out a month or two. Moving average resistance from the declining 50-day comes in at 1,957, with the declining 17-week exponential at 1,964 and the falling 43-week in the 2,000 region.
continue reading on the next page…


: Showing Some Signs of Emerging Strength")
