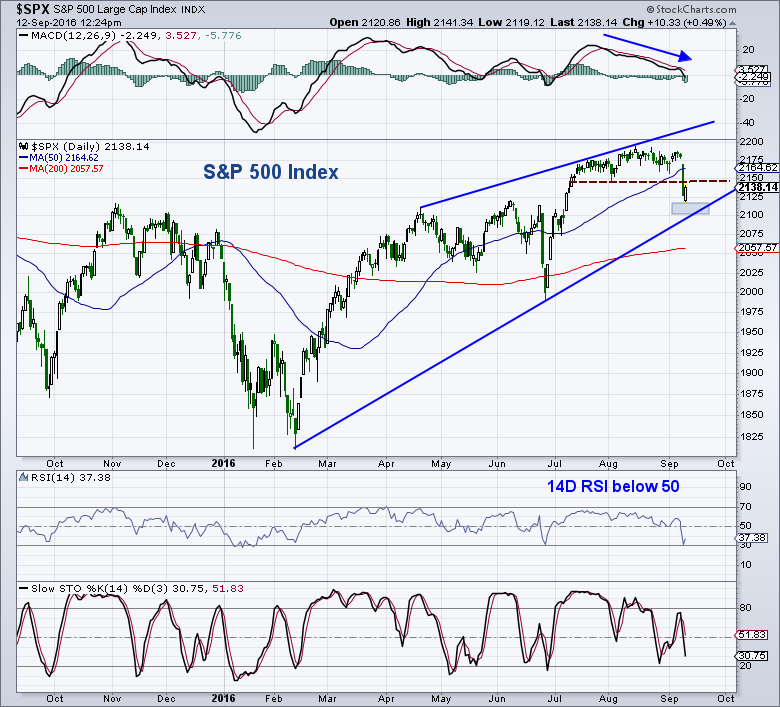
Looks like the S&P 500 Index (INDEXSP:.INX) is finally breaking down after slicing right through the 50-day moving average.
The S&P 500 broke through the bottom of its recent trading range (at 2,147.58) on Friday. This breakdown projects a measured move down toward the 2,100 area based on the size of the small top.
Note that this morning’s lows touched 2120 before the stock market bounced higher. I have been looking for a pullback down to the 2100-2135 area for a while.
The 14-Day Relative Strength Index (RSI) is below 50 while the daily MACD is close to negative territory. Both are warnings that at least a market pullback is here. Personally, I’ll be raising my stock allocations by layering into the decline at 2,120, and then again at 2,100.
S&P 500 Trading Chart (SPX)
You can contact me at arbetermark@gmail.com for premium newsletter inquiries.
Thanks for reading.
Twitter: @MarkArbeter
The author has a long position in S&P 500 related securities at the time of publication. Any opinions expressed herein are solely those of the author, and do not in any way represent the views or opinions of any other person or entity.


 Testing Important Price Support")


