One of the most enjoyable parts of my career has been spending time with traders and investors with a wide variety of backgrounds. Each market participant develops their own investment approach and it’s often influenced by their background, education, mentors, and market experiences.
An early mentor of mine told me to always be a student of the markets. I love the fact that experienced technical analysts such as the late Paul Desmond were still learning even after long and successful careers in the industry.
In the spirit of lifelong learning, I’ve always tried to be open to new ways of approaching investment decisions. It’s been a pleasure to meet other chart aficionados and ask questions about their methods. This has helped me develop and refine my own process for understanding the markets.
I’m often asked about a specific asset class or chart and I cringe when my response is met with, “Yeah, but shouldn’t it do X because of Y?” The X and Y are usually some combination of cycles, interest rates, the dollar, commodities, small caps, etc.
Welcome to the dangerous world of “Shouldn’t Investing” where you make decisions based on what a particular market shouldn’t do given some other assumptions you’ve made.
If you ever hear something like “shouldn’t small caps go up because of the dollar?” or “shouldn’t gold go up because it’s a safe haven?” or “shouldn’t October be down because it’s the third year of the cycle?” then you’re familiar with shouldn’t investing.
I prefer to traffic not in should’s or shouldn’t’s but instead in is’s and does’s. (My editor visibly cringed at that previous sentence.)
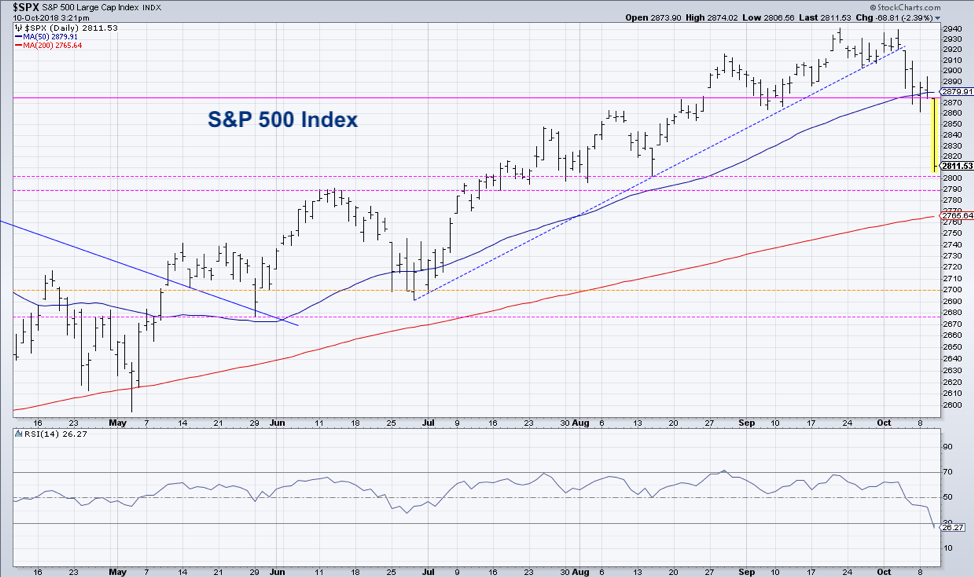
The S&P 500 has broken down through support around 2870 and is rapidly approaching the next short-term support level in the 2765-2800 range. This support area is based on previous lows as well as the 200-day moving average.
The daily RSI is around the oversold level of 30, which suggests a short-term upside recovery on the horizon. This would be confirmed if and when the RSI goes below and then back above the oversold level.
I’ll be watching how the S&P moves relative to this support range, especially in reaction to Wednesday’s selloff. There is no denying that we have now seen a lower low, which means we simply need a lower high to confirm a Dow Theory downtrend.
Why do we get so sucked in by shouldn’t investing? Because of narrative bias. We love stories. And we love feeling as if we have some control over the uncontrollable because we’ve allegedly figured out the narrative.
Shouldn’t the market bottom out in October? No idea.
Shouldn’t stocks go up because of the Dollar? Doesn’t matter.
Shoudn’t we see a rally because big tech names have corrected so much? Not necessarily.
Forget about the shouldn’t’s. Focus on the price and trust the trend.
Learn more about my research over at Sierra Alpha.
Twitter: @DKellerCMT
Any opinions expressed herein are solely those of the author, and do not in any way represent the views or opinions of any other person or entity.


 Testing Important Price Support")
")
