Similar to 2019, price was near a flat-to-downish orange 200-day moving average.
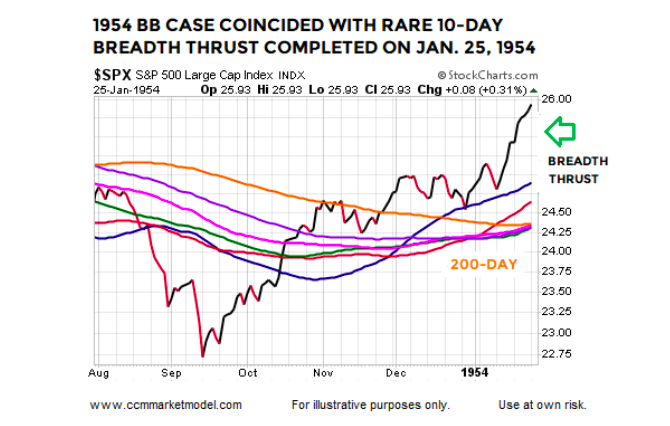
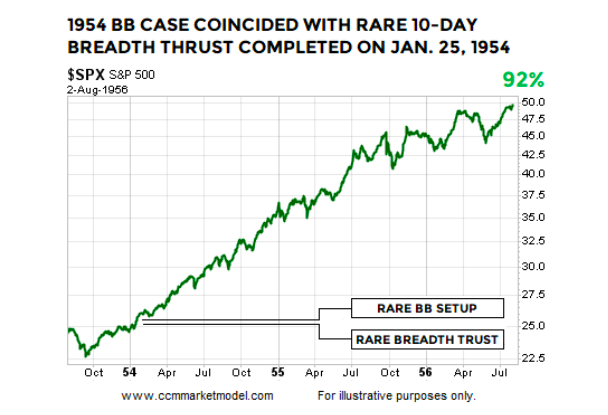
The 1954 case that featured both setups was followed by very satisfying gains in the S&P 500 Index.
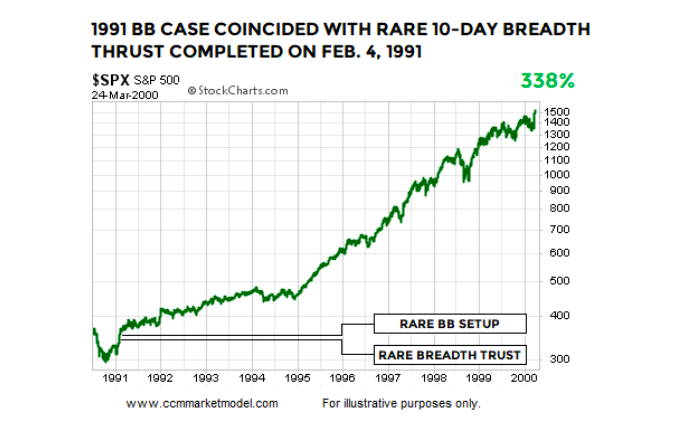
1991 DUAL SETUP CASE
The look of the monthly chart on the last trading day of January 1991 is similar to the rare look found at the end of January 2019.
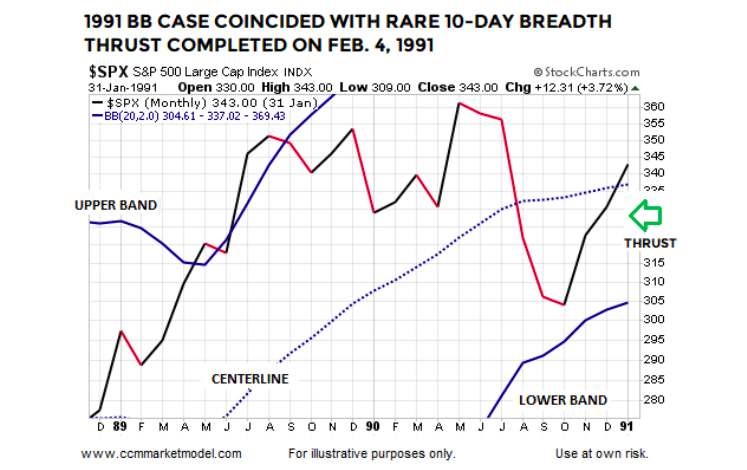
The ten-day breadth thrust was completed on February 4, 1991, or two trading days after the monthly Bollinger Band setup went into the books. Similar to 2019, price was near a flat-to-downish orange 200-day moving average.
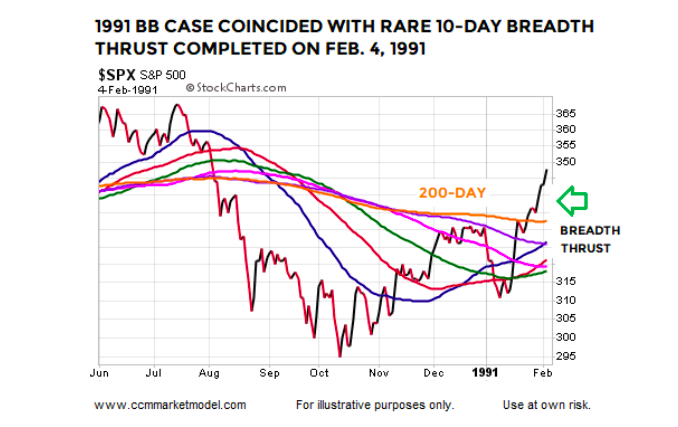
The 1991 case that featured both setups was followed by very satisfying gains in the S&P 500 Index.
DIGGING DEEPER
This week’s stock market video covers numerous historical cases that provide additional insight into the 2019 bull/bear debate.
2015: WEAKER TRENDS ARE MORE PRONE TO FAILURE
The 2015 Bollinger Band case reminds us a significant giveback remains a possibility in 2019. The 2015 monthly BB setup was unable to hold above the centerline and turned out to be a head fake.
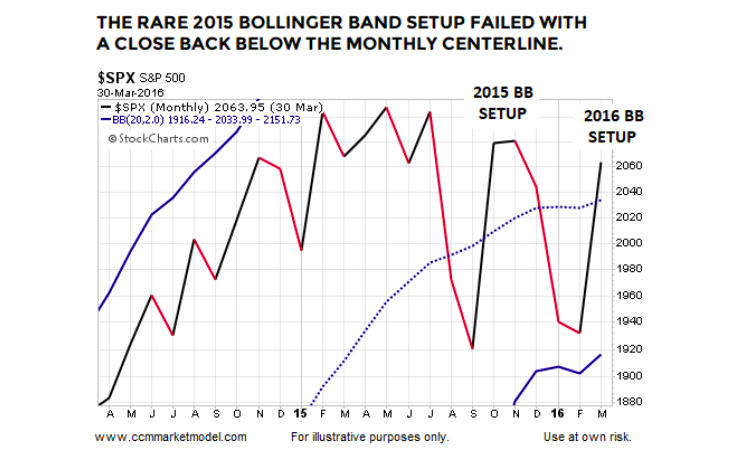
Two other reminders come from the 2015 case:
Markets with still-vulnerable trend profiles are more prone to reversals, givebacks, and setup failures.
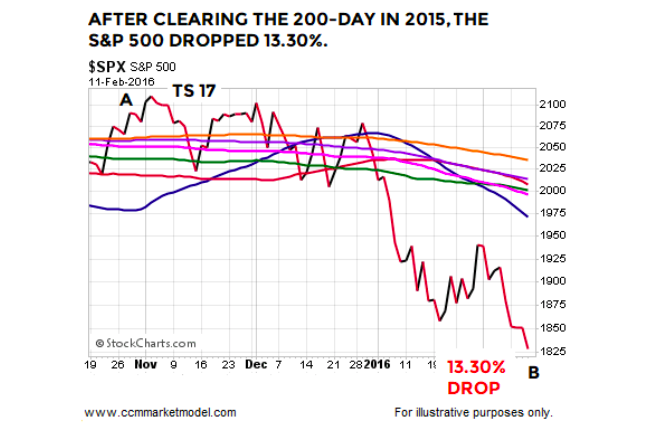
Closing above the orange 200-day moving average is far from an “all clear” signal in the stock market. In 2015, the S&P 500 closed above the 200-day for eight trading sessions, before falling 13.30%.
MORAL OF THE STORY
Having something concrete and measurable that differentiates 2018-2019 from three of the greatest percentage-decline bear markets in history (73-74, 00-02, 07-09) speaks favorably to bull/bear probabilities in February 2019.
However, the 1957 and 2015 cases remind us head fakes and lower lows are still in the realm of possibility. In those periods, the stay above the monthly Bollinger Band centerline was short lived, meaning intermediate-term concerns would increase in 2019 if the S&P 500 prints a monthly close back below the Bollinger Band centerline, which currently sits at 2685.
Twitter: @CiovaccoCapital
The author or his clients may hold positions in mentioned securities at the time of publication. Any opinions expressed herein are solely those of the author, and do not in any way represent the views or opinions of any other person or entity.


 Ready To Break Out?")
