There’s been a lot of action this past week and the stock market has quickly put the bulls on their heels. In this market update, we’ll take a closer look at charts of the S&P 500 and Nasdaq, while highlighting some key pieces of the puzzle to watch.
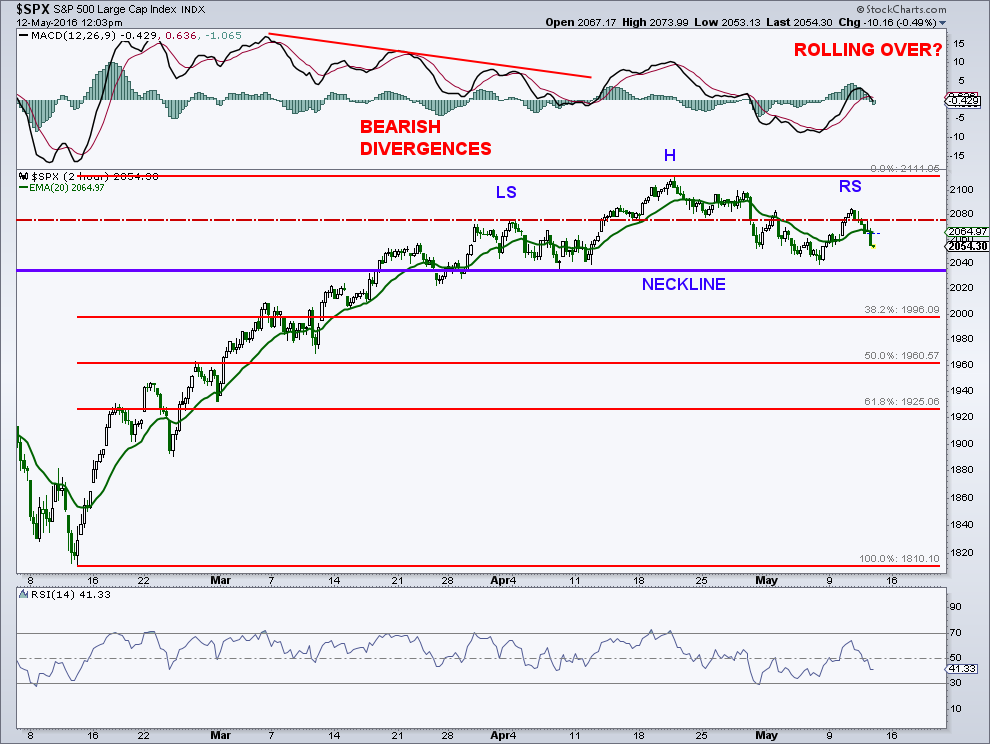
On the 2-hour chart of the S&P 500, we now have a right shoulder for the developing head-and-shoulders (H&S) I talked about in last week’s newsletter and market update. To confirm this bearish pattern, the “500” needs to break lateral neckline support at 2,034. We can then expect a measured move, based on the pattern size, down to the 1,957 area. A 50% retracement of the rally since February also targets this zone and comes in at 1,961.
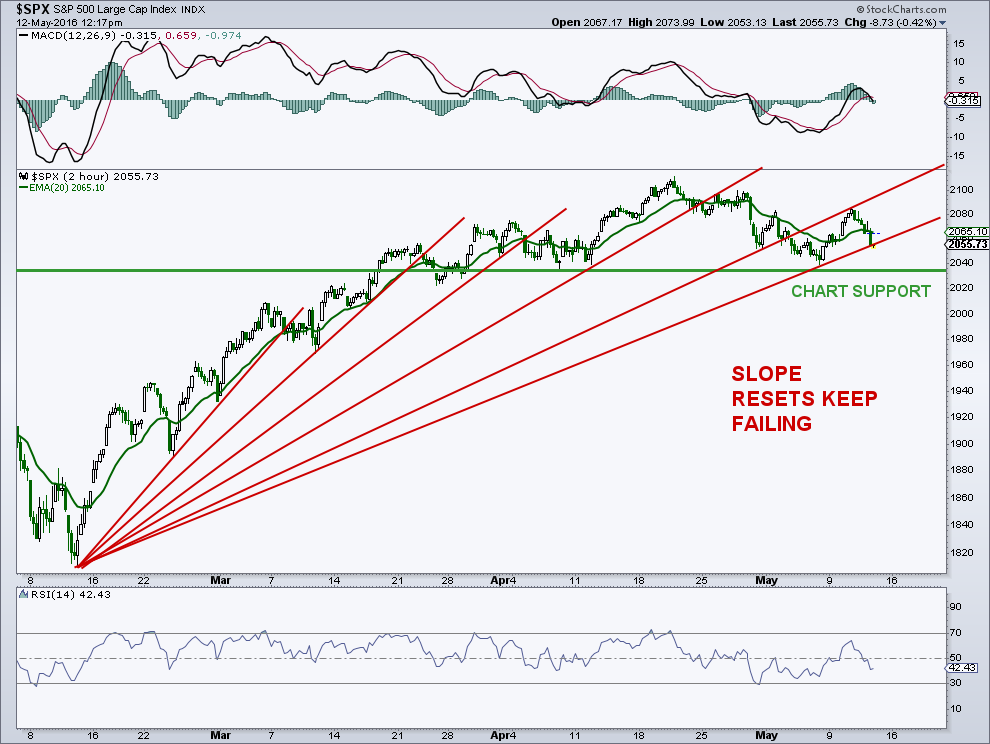
One of the other pieces of information we can gather from the 2-hour chart is that each attempt over the past couple of months to reset the slope has failed. This is a way to visual a loss of price momentum on the upside as the rally ages and a potential top takes shape. Basically, the more failures of these slope resets, the higher the chance that the index eventually breaks down. Very steep slopes are often seen at the beginning of an advance, and as I’ve said many times, these slopes are unsustainable. As the advance becomes more mature, the slope continually lessens. In recent years, these aging rallies have all rolled over. I really don’t think we will see a sustainable, rising slope until the large trading that has existed since 2014 is put to bed. Then again, that’s the nature of a trading range.
So, in the short- to intermediate-term, this could be an important inflection point for the stock market. Below 2,034 and more damage, and above 2,085 there is a decent shot for a move back to the top of the range and possibly more.
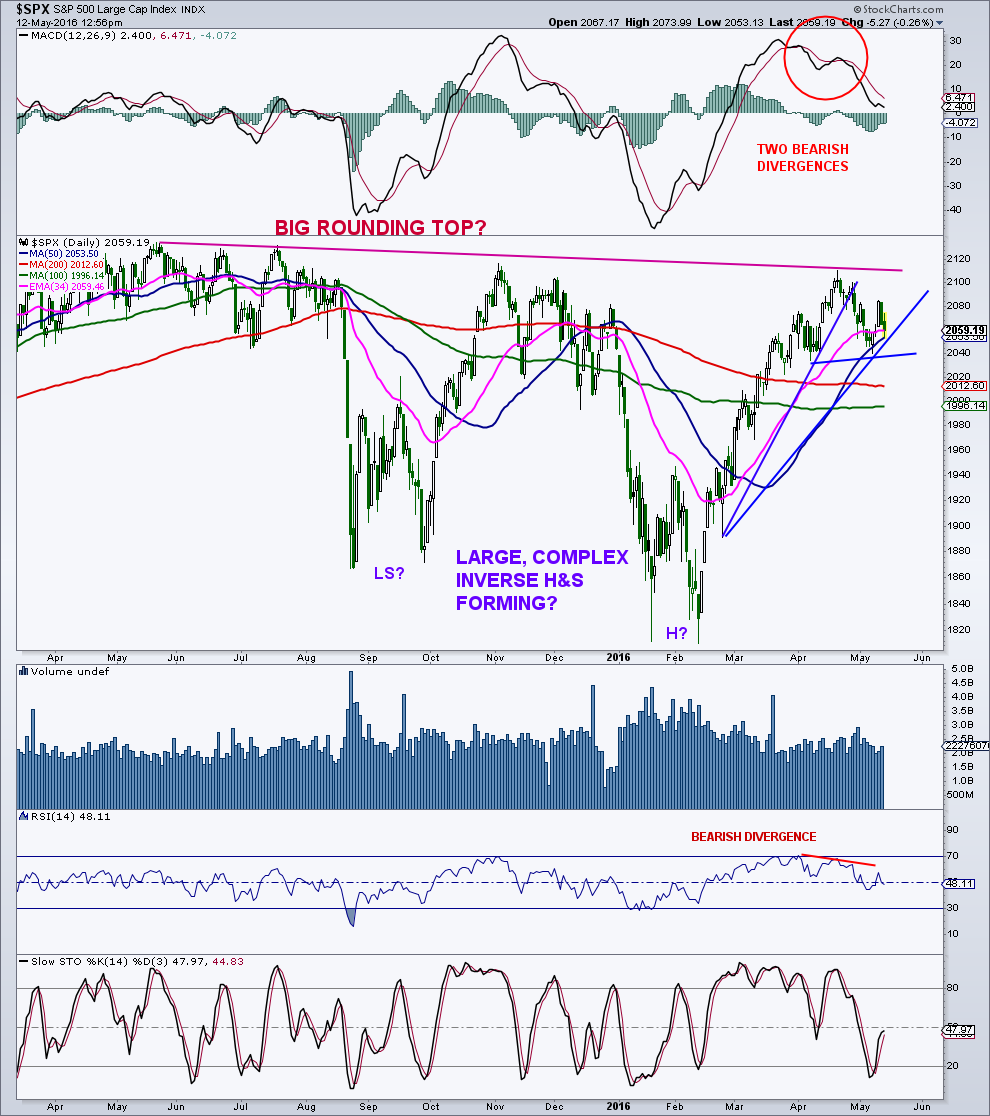
On the daily chart, the “500” tested the rising 50-day average again today and bounced. We saw the same thing back on May 6. It is generally a bullish sign when the S&P 500 backs and fills to the rising 50-day and respects this key average. On a break of 2,034, the flattish 200-day and potential support comes in at 2,013. Daily momentum is still working off overbought readings as well as bearish divergences.
A turn higher for the MACD while in positive territory would be bullish. The recent pullback has yet to send the 14-day RSI into oversold territory.
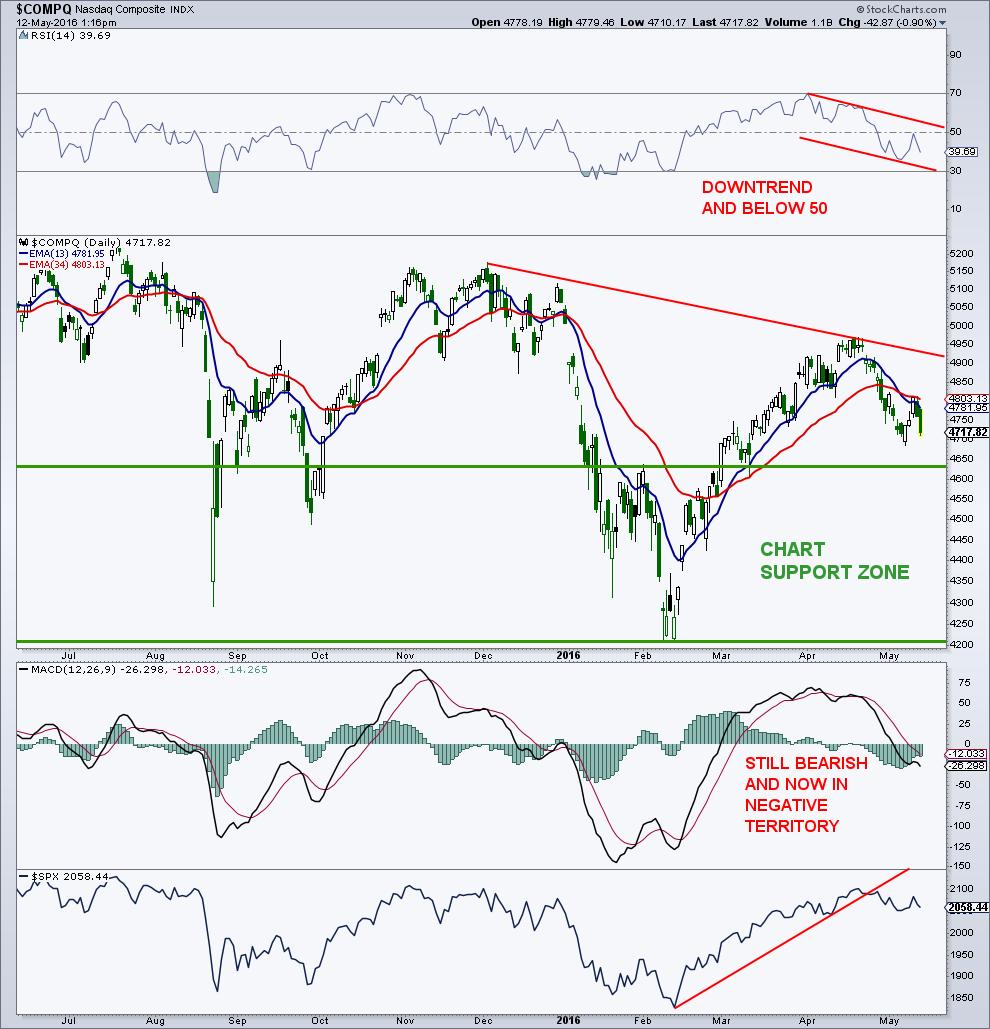
Is There A Canary In The Coal Mine?
The canary in the coal mine may be the NASDAQ Composite, at least for the intermediate term. The index has rolled over, taking out both the 13-day and 34-day exponential moving averages. The shorter average has broken below the longer average, generally not a good sign. The recent attempted rally failed at these averages, also a warning. The 14-day RSI has been in a downtrend since cycling into overbought territory in early April, and is below the 50 level, another warning. The MACD remains on a sell signal and has dropped into negative territory. Relative strength vs. the “500” has been in a minor downtrend since peaking on April 20. It is certainly possible that the underlying weakness in the NASDAQ drags down the rest of the market.
My market conclusion is the same. I’m still favoring more weakness in the short- to intermediate-term, as the potentially bearish patterns I talked about play out. The pullback so far has alleviated some of our sentiment and momentum concerns, but I would like to see more. An oversold market as well as one where sentiment is bearish again would be a much better setup for new all-time-highs later this year.
Thanks for reading and have a great week. You can contact me at arbetermark@gmail.com for premium newsletter inquiries.
More from Mark: 3 Reasons To Watch The Dollar Here
Twitter: @MarkArbeter
The author may have positions in mentioned securities at the time of publication. Any opinions expressed herein are solely those of the author, and do not in any way represent the views or opinions of any other person or entity.


