After a year without a legitimate stock market pullback (3 percent or more), the U.S. stock market indices are finally pulling back. To what extent, we don’t know. But February should be an interesting month.
It appears that lingering concerns have finally given way to a market pullback.
Let’s breakdown the latest action for stocks, bonds, and commodities and share some important investing research for the week ahead.
Key Takeaways: The stock market started 2018 on a positive note, but have stumbled hard this week. Near-term momentum has been weakening and finally turned down for both the S&P 500 and the broad market. The global uptrend in stocks still remains intact. Bond yields are moving higher and gold is attempting to break through resistance.
Even with its late-month stumble, the S&P 500 finished January with a gain in excess of 5%. In the past, this has positioned stocks well for continued strength as the year progresses. In the 12 previous instances in which the S&P 500 has gained 5% or more in January, stocks have added to their gains over the remainder of the year 11 times. 1987 was the sole exception.
With that history as backdrop, it may be premature to make too much of some near-term divergences that have emerged. We’ll get a clearer picture of the market pullback next week.
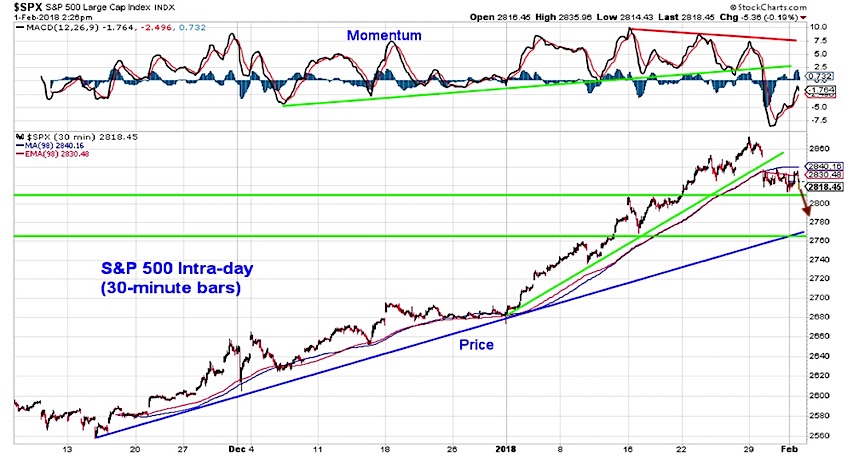
S&P 500 Index
It may be worth remembering that 2017 was the first year since the financial crisis that did not experience a surge in broad market momentum (Breadth Strong, But Not Without Flaws). This puts us on alert for additional evidence that momentum has slipped. That can be seen on the intra-day chart of the S&P 500. While price rallied over the course of January (until this week’s stumble), momentum peaked mid-month and made a series of lower highs before faltering this week. With price now below the trend that provided support last month, stocks could be facing further near-term consolidation. Support on the S&P 500 is near 2810, and again approaching 2760.
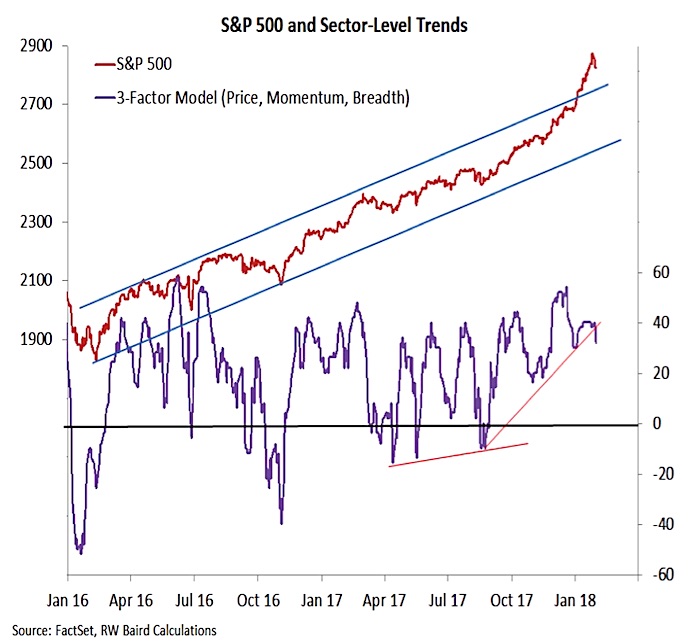
Not only did momentum divergences emerge in January, but our sector-level trend indicator never confirmed the strength seen on the S&P 500. Sector-level trends are now deteriorating – price and breadth trends have held steady at the sector level, but the loss in momentum evident on the S&P 500 is also showing up at the sector level. At this point, these divergences are minor and could easily be resolved. We are, however, seeing these cracks at a time when a lot of good news already appears to be priced into stocks (Elevated Expectations Make Upside Surprises More Of A Challenge).
While keeping an eye on these shorter-term developments, we should not forget that the rally continues to enjoy broad support. Some 88% of domestic industry groups remain in up-trends, and more than three-quarters of the world’s stock markets are above their 50-day averages. Deterioration in either of these measures would suggest the risk of a meaningful correction is on the rise. It is worth noting that even in the years when stocks rallied 5% in January, mid-year corrections of 8%-10% were not uncommon.
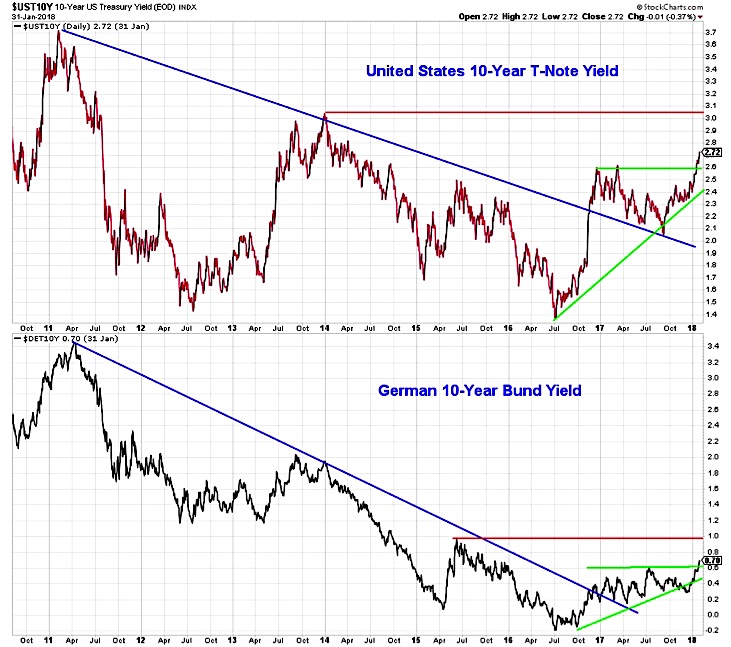
10-Year Treasury Yield
Working against stocks right now is the steady rise in bond yields. In the recent past, when stocks have started to struggle, bond yields have ticked lower and stocks have found support. This week, even with stocks stumbling, bond yields have continued to move higher. The rise in the 10-year T-Note yield is being supported by higher yields in Germany, supporting the view that this could be a sustained move that carries the T-Note yield toward 3.0%. This also comes as the market begins to price in four rate hikes from the Fed this year. Remember, the market has a history of testing new Fed leadership.
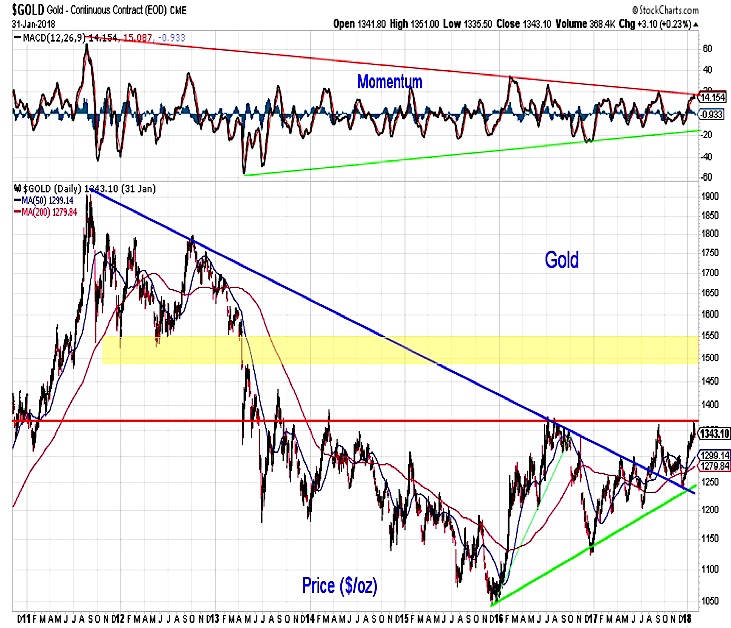
GOLD
While bond yields have broken through resistance, gold is still struggling to clear $1350. Getting above this level would take out the 2016 and 2017 peaks, and also break the down-trend in momentum that stretches back to the 2011 peak in gold. Clearing $1350 could lead to a test of resistance in the 1500-1550 range.
Thanks for reading.
Twitter: @WillieDelwiche
Any opinions expressed herein are solely those of the author, and do not in any way represent the views or opinions of any other person or entity.

 Testing Important Price Support")
: Cup (and Maybe Handle) Watch")

