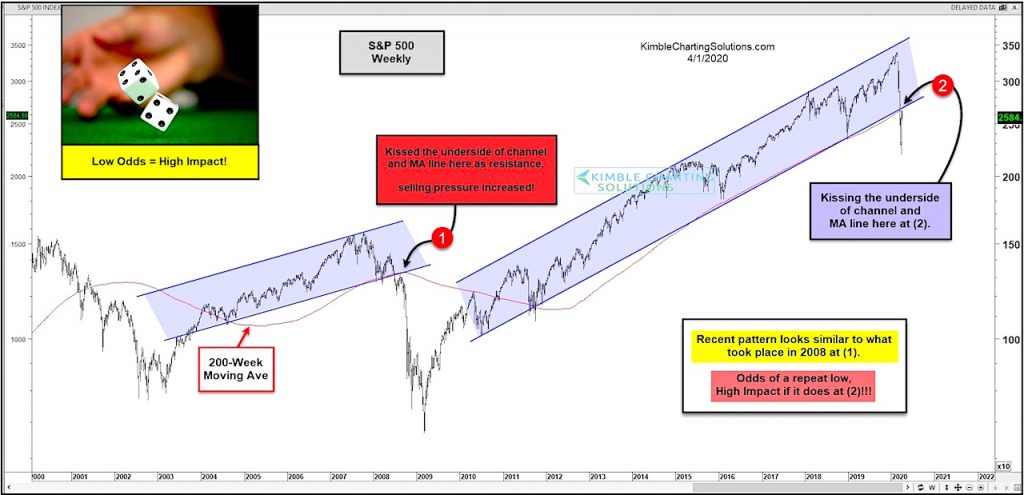
S&P 500 Index “weekly” Chart
Last week’s sharp rally off the lows, gave bulls some relief.
But if the bulls are going to have reason to cheer, they will need to see another move higher… and fast!
Why? Just look at today’s “weekly” price chart of the S&P 500 Index. INDEXSP: .INX
This key broad-based index broke a 10-year bull market trend line in March. And it’s now kissing the underside of the trend line at (2).
The last stock market crash saw a similar pattern in 2008. And after a failed “kiss” selling pressure accelerated. Sometimes things don’t “repeat”, but rather “rhyme”. Will we see selling pressure pick up? Stay tuned!
Note that KimbleCharting is offering a 2 week Free trial to See It Market readers. Just send me an email to services@kimblechartingsolutions.com for details to get set up.
Twitter: @KimbleCharting
Any opinions expressed herein are solely those of the author, and do not in any way represent the views or opinions of any other person or entity.

: Worrisome to Broader Market?")
