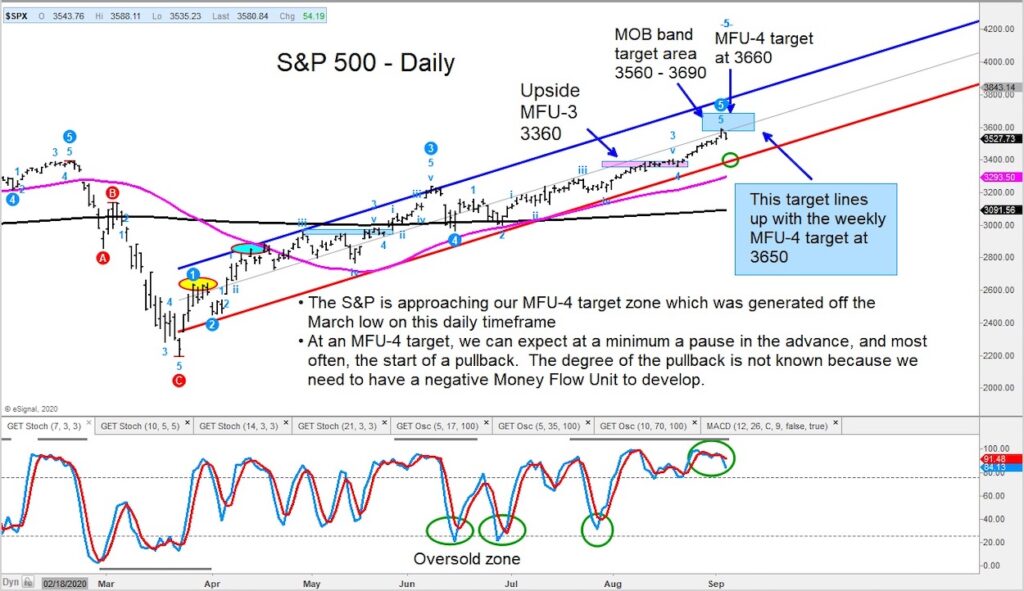
As noted in our latest article, the S&P 500 touched up near our MFU-4 price target (extreme) zone.
This target zone was generated off the March low and is between 3560 and 3690. I referred to this as a zone where “we can expect at a minimum a pause in the advance, and most often, the start of a pullback”.
Well, we touched up into the zone and are pulling back today. Given the momentum off this high, I believe this is the start of a pullback where we can see the index pullback to the lower end of the regression trend channel around 3390.
This area should act as support. And, in any event, this should be a bull-bear gauge to see if this is an ordinary pullback or start of something bigger (i.e. correction).
Below is the updated chart of the S&P 500 which we sent out Thursday morning.
Good luck out there and remain disciplined.
S&P 500 “daily” Chart
The author may have a position in mentioned securities at the time of publication. Any opinions expressed herein are solely those of the author, and do not in any way represent the views or opinions of any other person or entity.


