Stocks are starting to perk up a bit, but still have work to do.
Since stumbling down to 3636, the S&P 500 Index has bounced nearly 300 points. That’s a nice bear market rally.
How would we know if this rally is something more than just that?
Well, today we look at the chart and discuss some guideposts to follow. Making a plan and understanding how to evaluate the market without emotions is key. Let’s take a look at the chart and keep it simple.
Note that the following MarketSmith charts are built with Investors Business Daily’s product suite.
I am an Investors Business Daily (IBD) partner and promote the use of their products. The entire platform offers a good mix of analysts, education, and technical and fundamental data.
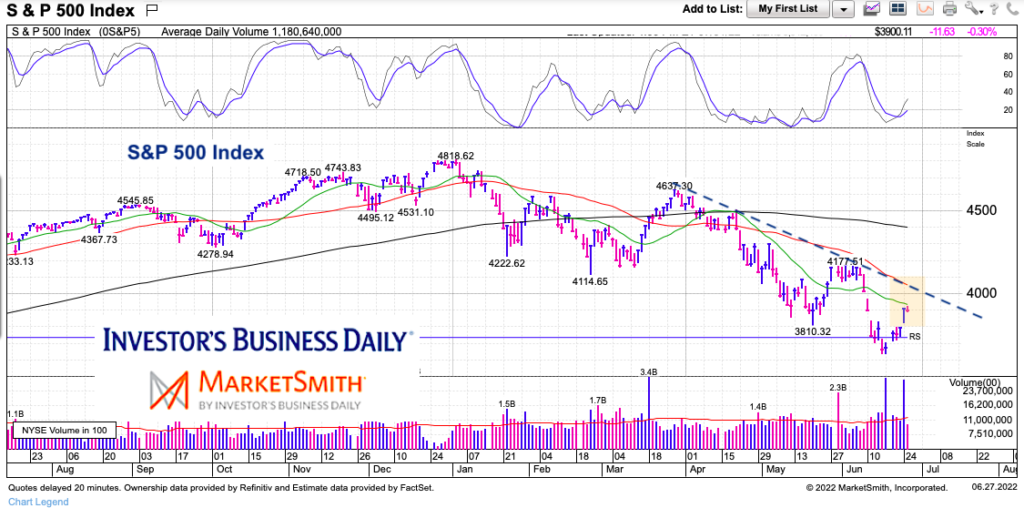
S&P 500 Index “daily” Chart
The recent bounce has taken us back up to the 20 day moving average. Should we clear the 20-day MA, then we would be looking at the 50-day moving average and falling short-term trend line. This resistance is pretty important – breaking out over it would be constructive and allow for a move to the recent highs around 4177. That’s 7% from here. A move over recent highs would be more bullish and open up to Fib retracement analysis and higher trend lines. Stay tuned.
Twitter: @andrewnyquist
The author may have a position in mentioned securities at the time of publication. Any opinions expressed herein are solely those of the author, and do not in any way represent the views or opinions of any other person or entity.


 Rolling Over At Key Fibonacci Level?")
