Broad Stock Market Outlook for March 23, 2018
As with yesterday, this morning’s action across the board looks weak as deeper supports are tested across the board and we trend lower. As more morning bounces are attempted across the stock market indices, they are still likely to fail, as there are trapped buyers in overhead spaces. Big pictures (weekly, and daily) are sideways but intraday formations look bleakly negative.
However, we are oversold so traders need to manage their bias.
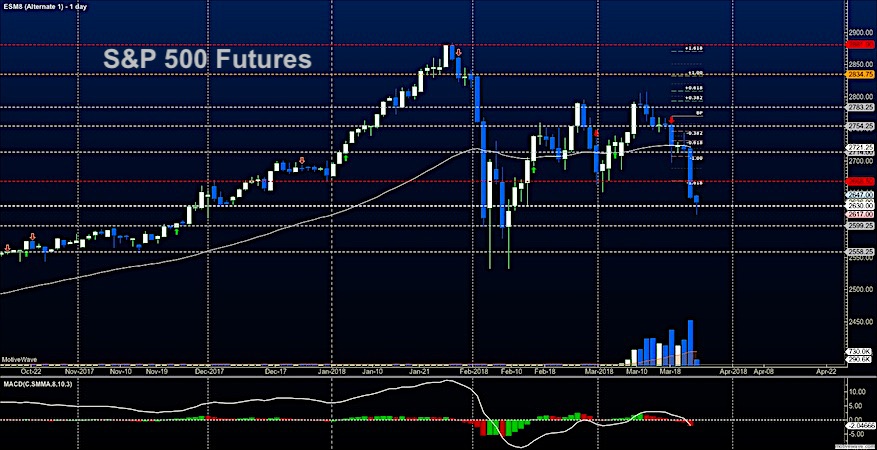
S&P 500 Futures
Support broken again -by sellers taking the upper hand and skittish traders sit on both sides of bias. We still sit in bearish patterns intraday with another morning at key support so we should bounce off the morning lows. First pass bounces should still fade as volume increases. Watch for the failure to dip lower. If morning lows are lost in these environments, we will sell off again. The bullets below represent the likely shift of trading momentum at the positive or failed retests at the levels noted.
- Buying pressure intraday will likely strengthen with a bullish retest of 2652.5
- Selling pressure intraday will likely strengthen with a bearish retest of 2623.5
- Resistance sits near 2647.5 to 2663.75, with 2696.25 and 2721.75 above that.
- Support sits between 2617 and 2599.75, with 2580.5 and 2558.50.
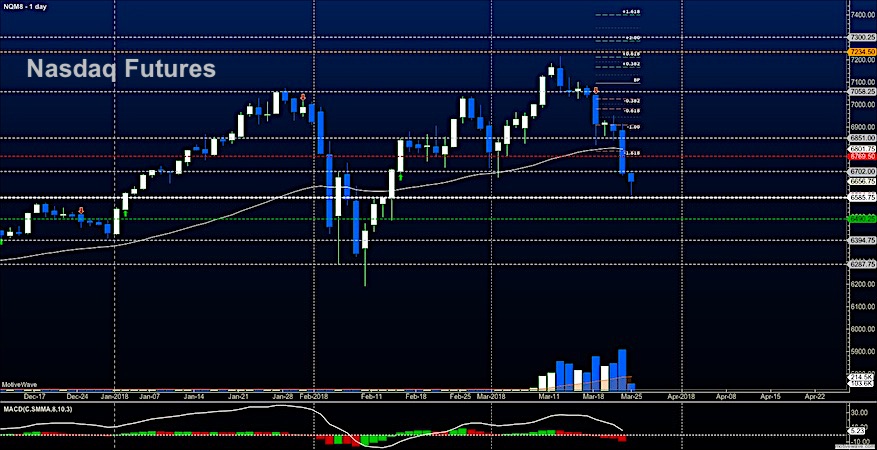
NASDAQ Futures
A measured move shows support tests here in the early morning as the bearish motion continues. Buyers are trying to pick a bottom again but if this is a bottom, it is likely to be ‘U’ shaped with a potential for another low in the mix. Resistance remains formidable as long as we sit below 6760. The bullets below represent the likely shift of intraday trading momentum at the positive or failed tests at the levels noted.
- Buying pressure intraday will likely strengthen with a bullish retest of 6676.25
- Selling pressure intraday will likely strengthen with a bearish retest of 6614.5
- Resistance sits near 6702.5 to 6760.5 with 6801.5 and 6851.5 above that.
- Support sits between 6615.75 and 6582.75, with 6490.25 and 6394.75 below that.
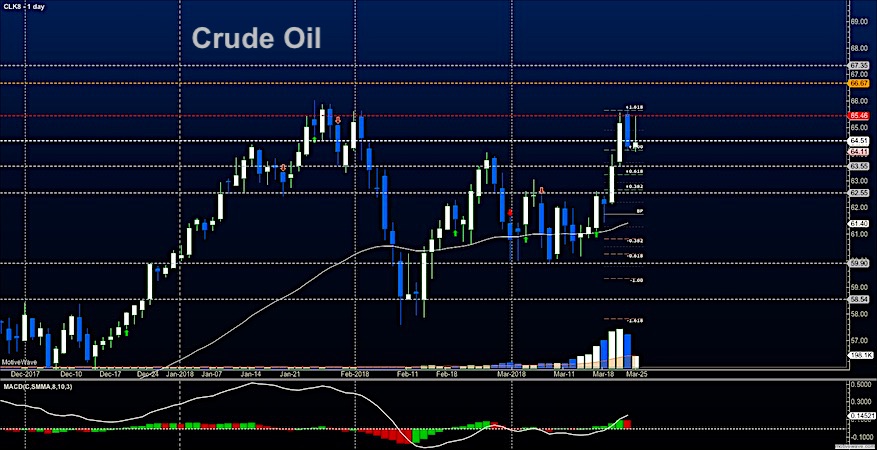
WTI Crude Oil
Expansions to higher resistance stopped at the 65.7 for the second day and now bouncing off support but a battle in this zone clearly exists. Momentum remains bullish and the price is somewhat extended but the formation suggests that pullbacks will still be buying zones as we are holding the support area near 63.9. The bullets below represent the likely shift of intraday trading momentum at the positive or failed tests at the levels noted.
- Buying pressure intraday will likely strengthen with a bullish retest of 65.05
- Selling pressure intraday will strengthen with a bearish retest of 64.07
- Resistance sits near 65.42 to 65.7, with 66.54 and 67.31 above that.
- Support holds near 64.30 to 63.96, with 63.51 and 62.27 below that.
Twitter: @AnneMarieTrades
The author trades stock market futures every day and may have a position in mentioned securities at the time of publication. Any opinions expressed herein are solely those of the author, and do not in any way represent the views or opinions of any other person or entity.


