Outlook for S&P 500 futures for May 23, 2016 – Significant overhead supply sits near 2057.5 at this time, and we sit near familiar regions of days and weeks past near 2046.5. So the battle between bulls and bears continues into this week.
Deeper support on S&P 500 futures sits below at 2038.5, and 2032.5, while resistance sits between 2057.5 and 2071.5. We remain range bound, but consideration of the charts failing to bounce sharply, and repeated tests of the baseline support levels, bodes poorly for buyers.
To me, this behavior is a signal of real potential weakness, but as long as price holds, we can only hold this as food for thought, and not evidence of future declines.
Momentum on the four-hour chart of stock market futures is bullish, and lifting but sitting in neutral spaces. That suggests a bounce will hit resistance and fade, but the fade should bring higher support if the momentum formation holds stable in the moves of price.
The edges of support and resistance in range-based formations gives us high rates of return. But we must be wise to scale out of positions at first and second targets, as well as pay attention to our stops and risk relationships.
See today’s economic calendar with a rundown of releases.
THE RANGE OF TUESDAY’S MOTION
E-mini S&P 500 Futures (ES_F)
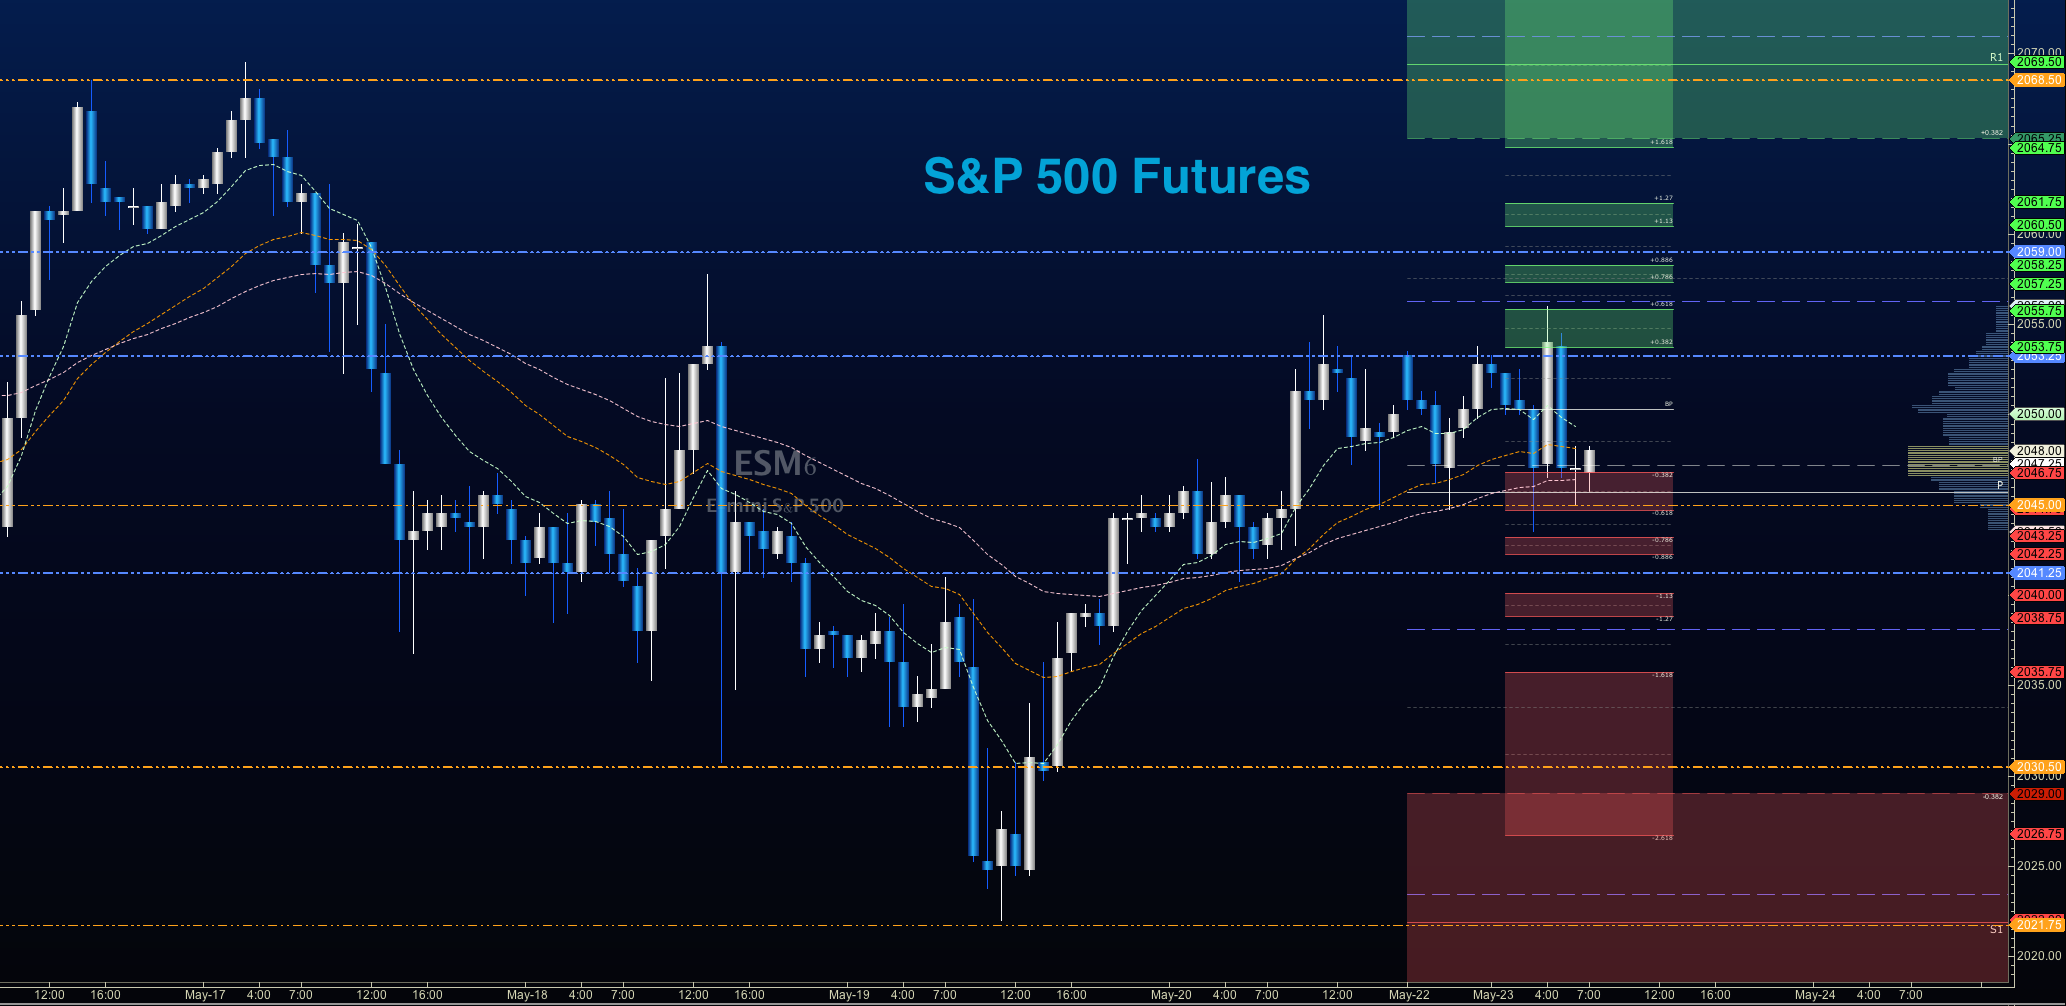
S&P 500 futures analysis for May 23, 2016 – Momentum sits with the buyers currently, and they are holding support at this writing. Holding 2041.5 this morning will be key for buyers to gain courage to advance price in the battle here today. Sellers are in command near 2056 at this time.
Upside trades on S&P 500 futures – Favorable setups sit on the positive retest of 2057.5, or a positive retest of 2046.5 with positive momentum. I use the 30min to 1hr chart for the breach and retest mechanic. Targets from 2046.5 are 2049.75, 2052.5, 2055.25, and if we can catch a bid there, we could expand into 2057.5 and 2061.75. A retest of these levels that hold will press the chart into resistance ahead near 2067.5.
Downside trade on S&P 500 futures – Favorable setups sit below the failed retest of 2041.5 or at the failed retest of 2051.5 with negative divergence. It is important to watch for higher lows to develop with the 2051.5 entry as the chart is extremely congested near this zone today. Retracement into lower levels from 2051 gives us the targets 2047.5, 2043.25, 2041.5, 2038.5, 2034.5, 2031.25, 2029.5, 2026.5, and perhaps a retest near 2025 before bouncing.
Have a look at the Fibonacci levels marked in the blog for more targets.
Crude Oil Futures (CL_F)
Outlook for Crude Oil for May 23, 2016 – With price movement generated by a flurry of stops executed (my thoughts on what happened on Thursday), it was not unreasonable to expected some measure of retracement. And indeed, crude oil prices have retraced almost the entire move upward from that time on Thursday. So, we essentially sit in a decision zone near 47.74, with buyers having the burden of proof to hold this level today. As it stands, I suspect bounces to fail, but not without some kind of fight.
The trading range for crude oil suggests support action near 47.03, and resistance behavior near 48.35.
Upside trades for crude oil can be staged on the positive retest of 47.76, or after a deep dip into 47.05, but carefully watch for a lower high to develop with that deep drift. I often use the 30min to 1hr chart for the breach and retest mechanic. Targets from 47.76 are 47.99, 49.1, 48.27, and 48.34. If we expand over that, we could see 48.65, 48.8, 49.09, and 49.29. This week’s API report and EIA report may likely be affected by Nigeria disruption and elsewhere troubles, and should certainly weigh on price action.
Downside trades for crude oil continue to setup well below failed retests. Today, this is the failed retest of 47.67, or the failure at the retrace of 48.34 under negative divergence gives us the trades with high reward to risk events. Retracement into lower levels from 48.34 give us the targets 48.17, 47.76, 47.42, 47.26, and perhaps 47.04, 46.76, and 46.44.
If you’re interested in the live trading room, it is now primarily stock market futures content, though we do track heavily traded stocks and their likely daily trajectories as well – we begin at 9am with a morning report and likely chart movements along with trade setups for the day.
As long as the trader keeps himself aware of support and resistance levels, risk can be very adequately managed to play in either direction as bottom picking remains a behavior pattern that is developing with value buyers and speculative traders.
Twitter: @AnneMarieTrades
The author trades stock market futures every day and may have a position in mentioned securities at the time of publication. Any opinions expressed herein are solely those of the author, and do not in any way represent the views or opinions of any other person or entity.


