Outlook for S&P 500 futures April 26 – Waiting on the Fed – The Federal Open Market Committee (FOMC) is set to release a statement tomorrow, and in the meantime, the stock market indices are holding support regions into the announcement.
Our overhead resistance levels for S&P 500 futures remain the same. Support is soft and extends into 2071 from 2076.6.
The Morning Report: Waiting On The Fed
Stock market futures remain trapped in a range that could press into old levels of resistance, but until we see a breach and retest of the congestion levels near 2098 with momentum, we are such to stay in this choppy mode. Today, the battleground is widening with two regions of interest on the upside -2082-2087, above that level and things get a bit more bullish intraday into resistance at 2092-2096.
The weight of motion is still on buyers keeping the key level of 2082 to hold. So far, we’ve dipped into 2081.5 before bouncing.
S&P 500 futures declines into familiar regions near 2074-2071.5 should still find buying support, but it is important to watch for lower highs to set up on the bounces here to signal that short action intraday is building. Sellers have held our resistance near 2092, so watch that failed test if you want to enter short on resistance. If that fight resolves upward, buying action will shift us into the regions near resistance at 2094-2096. If not, we see the drift back into 2082.5 on the horizon and perhaps lower if momentum shifts. Higher resistance sits near 2101.75 to 2105.75. Deeper support holds at 2068.5- 2071.5.
Momentum on the four hour chart is neutral and we should see range bound behavior across stock market futures with the Fed meetings into the next two days weighing on markets. Watch for the momentum to shift in shorter time frames, and a breach and hold of the edges mentioned to signal a potential trending move.
See today’s economic calendar with a rundown of releases.
THE RANGE OF THURSDAY’S MOTION
Crude Oil Futures (CL_F)
Outlook for crude oil for April 26 – 43.30 -43.40 remains a region of extreme congestion in recent days for crude oil futures. Note that we have the API report after the close today.
Range expansion is likely if crude oil prices can breach and hold 43.65 but only into resistance as momentum shifts a bit negative in the shorter time frames as the charts work to test support.
Today, the trading ranges on crude oil are 42.25 -44.49. We’ve rejected that upper end a few times, but until we lose support regions below, our slant should remain bullish. As always, my eyes look for the lower highs in these spaces near obvious resistance from which we have recently receded.
Moving averages in oil are mixed to slightly down on tighter intraday time frames, and bullish to mixed on longer time frames – giving us the likely pattern of support bounces into resistance and reversals back into support for the day ahead- and this has been the case for several days. I am looking for resolution of this range based formation, but so far, it has not arrived. Regions near 41-40.78 look particularly favorable as a retest below in the current formation. That means the short actions should open at the tests of resistance, but due to mixed currents, shorts should always be on the lookout for the higher lows potentially developing.
Intraday long trading setups on crude oil futures suggest a long off a 42.96 retest, or the 43.45 positive retest on the pullback (check momentum here at low level bounce, and watch the region at 43.75 for sellers) into targets of 43.2, 43.42, 43.74, 43.97, 44.12, and if buyers hold on, we’ll see 44.45 to 45.13.
Intraday short trading setups suggest a short below a 42.86 failed retest, or the failed retest of 43.3 (with negative momentum prevailing) sends us back through targets at 43.14, 42.94, 42.68, 42.54, 42.29, 42.07, and 41.8, if sellers hang on.
Have a look at the Fibonacci levels marked in the blog for more targets.
E-mini S&P 500 Futures (ES_F)
Below is a S&P 500 futures chart with price support and resistance trading levels for today. Click to enlarge.
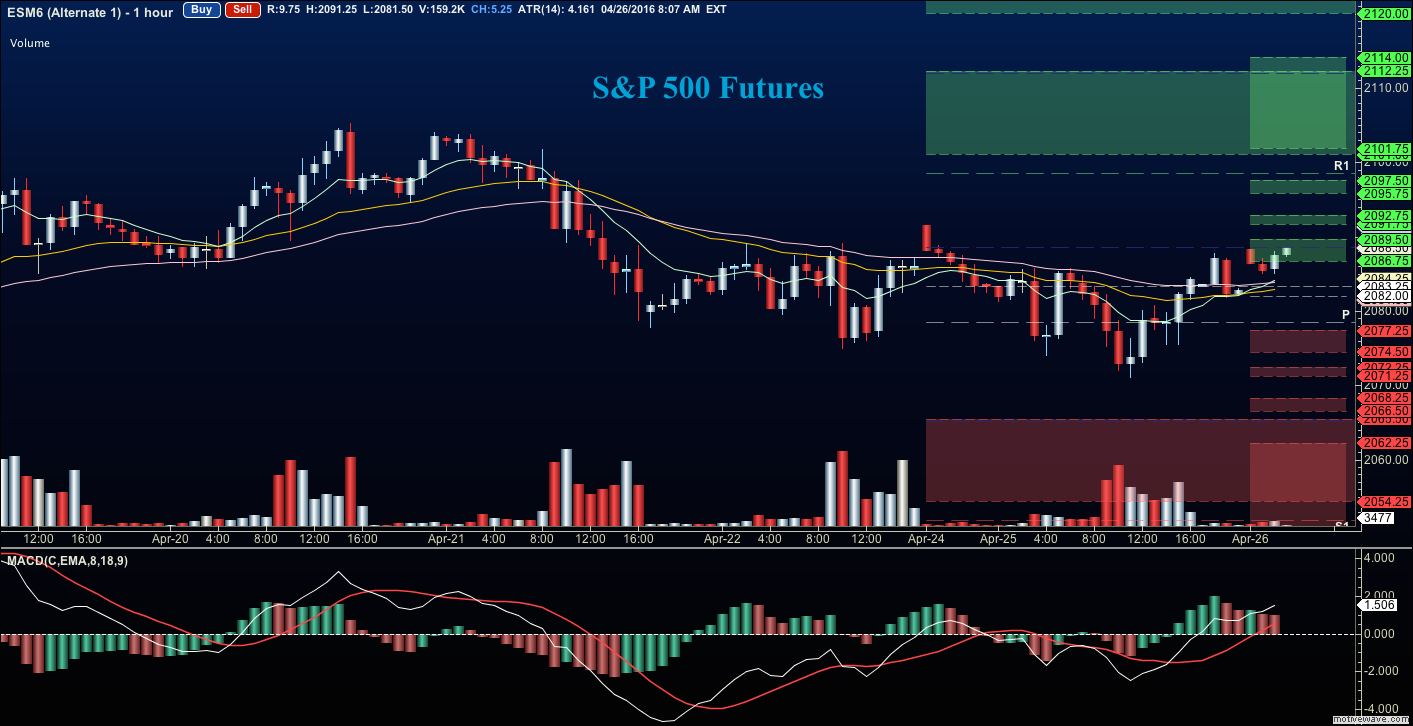
In-depth outlook for S&P 500 futures April 26 – The levels between 2098.75- 2104.25 serve as important resistance. Front line support sits near 2071.5- 2074 region. Buyers are holding support for now in a moving average squeeze, but with damp momentum. This is the same formation that held yesterday.
Upside motion has the best setup on the positive retest of 2084.75 or a bounce off 2077.75 with positive momentum – eyes on congestion at 2082.75 -2084.75 with this 2077.75 entry. I use the 30min to 1hr chart for the breach and retest mechanic. Targets from 2077.25 are 2080.25, 2082.5, 2085.75, 2088.25, 2091.5, 2094.5, and if we can catch a bid there, we could expand into 2098.5 to 2104.75. Long action is still trending over the bigger picture for now, but momentum continues to slow. We open the day under neutral momentum.
Downside motion opens below the failed retest of 2081.25 or at the failed retest of 2091.5 with negative divergence (careful here- watch for the higher low to develop to tell you that an early exit might be necessary- likely near 2084.5). Retracement into lower levels from 2091 gives us the targets 2088.75, 2085.50, 2082.5, 2078, 2075.25, 2072, and perhaps 2071.5 to 2068.5. Buyers should still come to the rescue at the deep support, particularly at the first pass.
If you’re interested in the live trading room, it is now primarily stock market futures content, though we do track heavily traded stocks and their likely daily trajectories as well – we begin at 9am with a morning report and likely chart movements along with trade setups for the day.
As long as traders remain aware of support and resistance levels, risk can be very adequately managed to play in either direction as bottom picking remains a behavior pattern that is developing with value buyers and speculative traders.
Thanks for reading.
Twitter: @AnneMarieTrades
The author trades stock market futures every day and may have a position in mentioned securities at the time of publication. Any opinions expressed herein are solely those of the author, and do not in any way represent the views or opinions of any other person or entity.


